Home /
Expert Answers /
Statistics and Probability /
which-plot-represents-a-stemplot-of-the-data-a-identify-the-two-values-that-are-closest-to-the-mi-pa811
(Solved): Which plot represents a stemplot of the data? A. Identify the two values that are closest to the mi ...
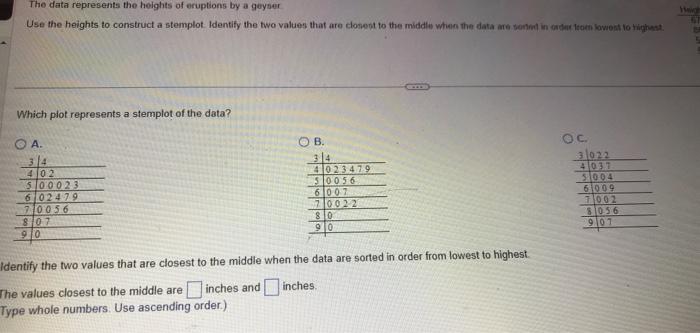
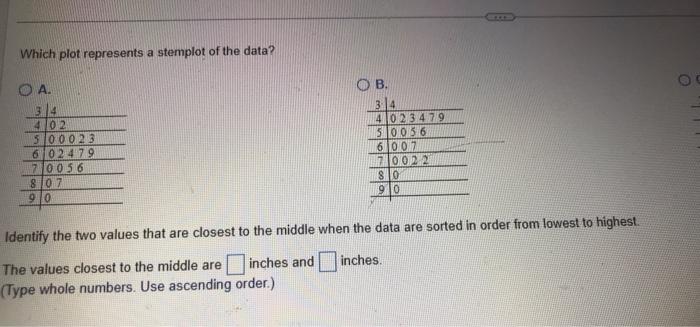
Which plot represents a stemplot of the data? A. Identify the two values that are closest to the middle when the data are sorted in order from lowest to highest. The values closest to the middle are inches and inches. Type whole numbers. Use ascending order.)
Which plot represents a stemplot of the data? A. Jentify the two values that are closest to the middle when the data are sorted in order from lowest to highest. he values closest to the middle are inches and inches. ype whole numbers. Use ascending order.)
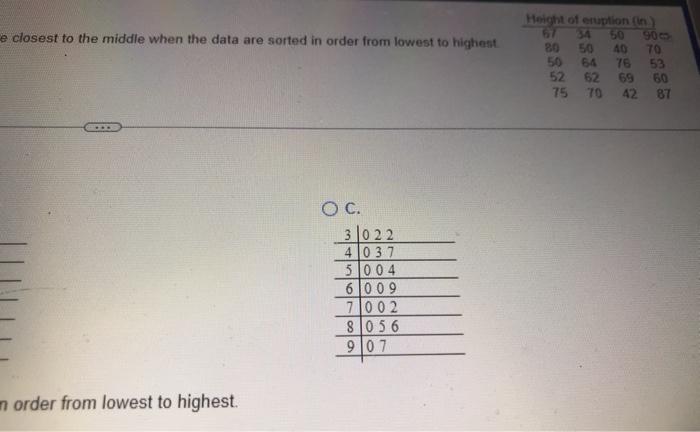
closest to the middle when the data are sorted in order from lowest to highest. C. order from lowest to highest.
Expert Answer
The data in increasing order is 34 ,40 ,42, 50, 50,