Home /
Expert Answers /
Economics /
which-of-the-following-examples-represents-the-relationship-between-division-of-labor-and-productio-pa628
(Solved): Which of the following examples represents the relationship between division of labor and productio ...
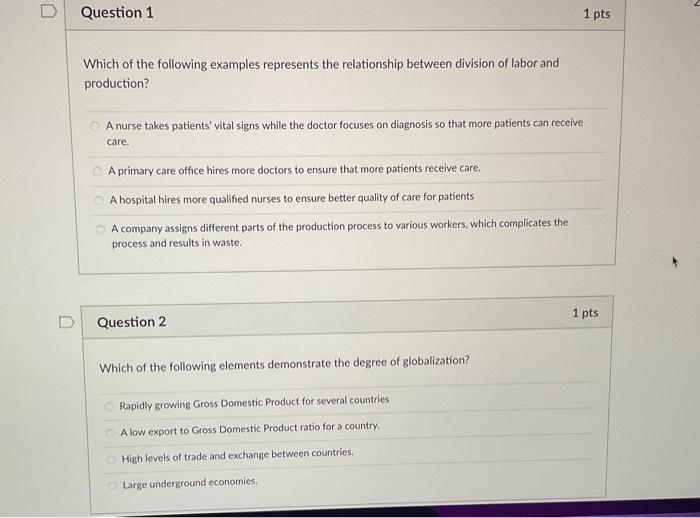
Which of the following examples represents the relationship between division of labor and production? A nurse takes patients' vital signs while the doctor focuses on diagnosis so that more patients can receive care. A primary care office hires more doctors to ensure that more patients receive care. A hospital hires more qualified nurses to ensure better quality of care for patients A company assigns different parts of the production process to various workers, which complicates the process and results in waste. Question 2 \( 1 \mathrm{pts} \) Which of the following elements demonstrate the degree of globalization? Rapidly growing Gross Domestic Product for several countries A low export to Gross Domestic Product ratio for a country: High levels of trade and exchange between countries. Large underground economies.
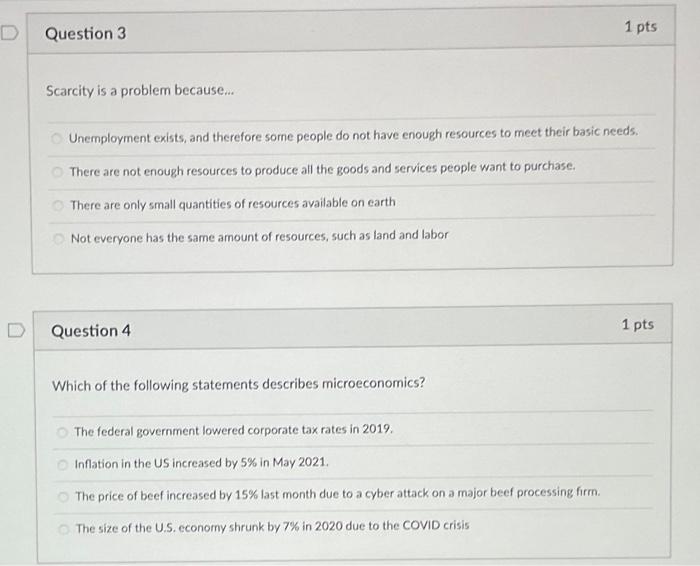
Scarcity is a problem because... Unemployment exists, and therefore some people do not have enough resources to meet their basic needs. There are not enough resources to produce all the goods and services people want to purchase. There are only small quantities of resources available on earth Not everyone has the same amount of resources, such as land and labor Question 4 1 pts Which of the following statements describes microeconomics? The federal government lowered corporate tax rates in \( 2019 . \) Inflation in the US increased by \( 5 \% \) in May \( 2021 . \) The price of beef increased by \( 15 \% \) last month due to a cyber attack on a major beef processing firm. The size of the U.S. econorny shrunk by \( 7 \% \) in 2020 due to the COVID crisis
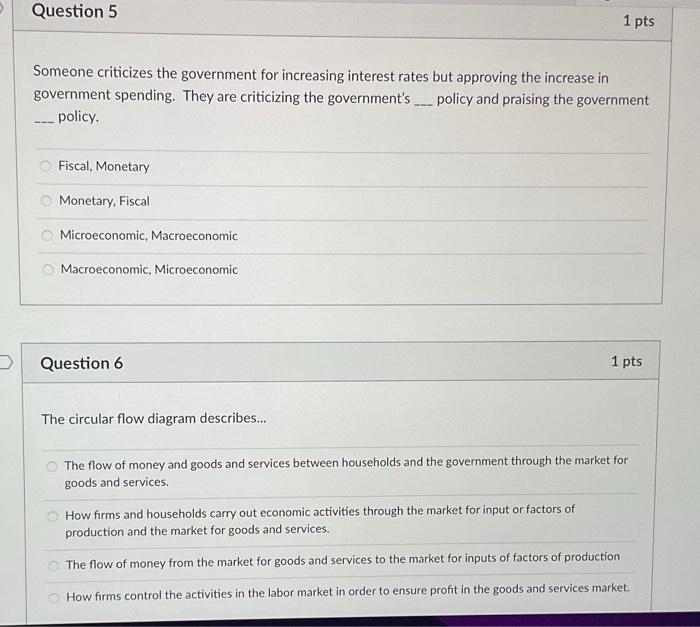
Someone criticizes the government for increasing interest rates but approving the increase in government spending. They are criticizing the government's policy and praising the government policy. Fiscal, Monetary Monetary, Fiscal Microeconomic, Macroeconomic Macroeconomic, Microeconomic Question 6 1 pts The circular flow diagram describes... The flow of money and goods and services between households and the government through the market for goods and services. How firms and households carry out economic activities through the market for input or factors of production and the market for goods and services. The flow of money from the market for goods and services to the market for inputs of factors of production How firms control the activities in the labor market in order to ensure profit in the goods and services market.