Home /
Expert Answers /
Biology /
which-of-the-following-diagrams-shows-a-steady-state-which-of-the-following-diagrams-shows-a-steady-pa859
Expert Answer
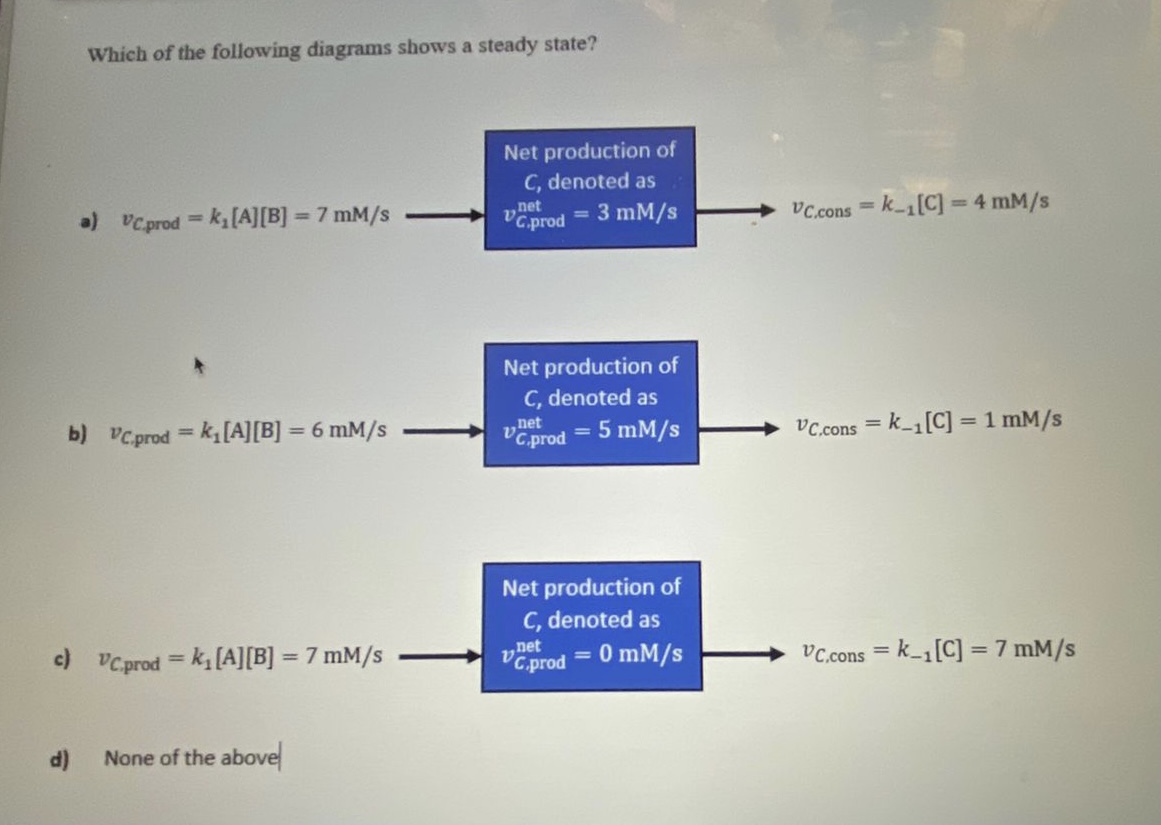
1. In these three steady states, the c study state is correct:In this steady state, we determine to compare the rates of production and consumption of component CVC.prod =K2 [A][B] = 7 mM/s = Net production of C, denoted as Vnetc.prod = 0 mM/s =VC.cons =K-1 [C] =7mM/sBased on the above information, we conclude that the system is indeed in a steady stateVC. prod =K2 [A][B] = 7 mM/s is a( rate of C production)VC. cons =K-1 [C] =7mM/s is a ( rate of C consumption) V net c. prod= 0 mM/s( net production of c)1. In this state, the rate of production should be equal to the rate of consumption, however, we can see that VC. Prod and VC. Cons are both equal to7mM/s which means the rate of C production matches the rate of C consumption