Home /
Expert Answers /
Statistics and Probability /
when-estimating-the-range-of-the-population-data-we-are-interested-in-the-lowest-and-highest-value-pa991
(Solved): When estimating the range of the population data, we are interested in the lowest and highest value ...
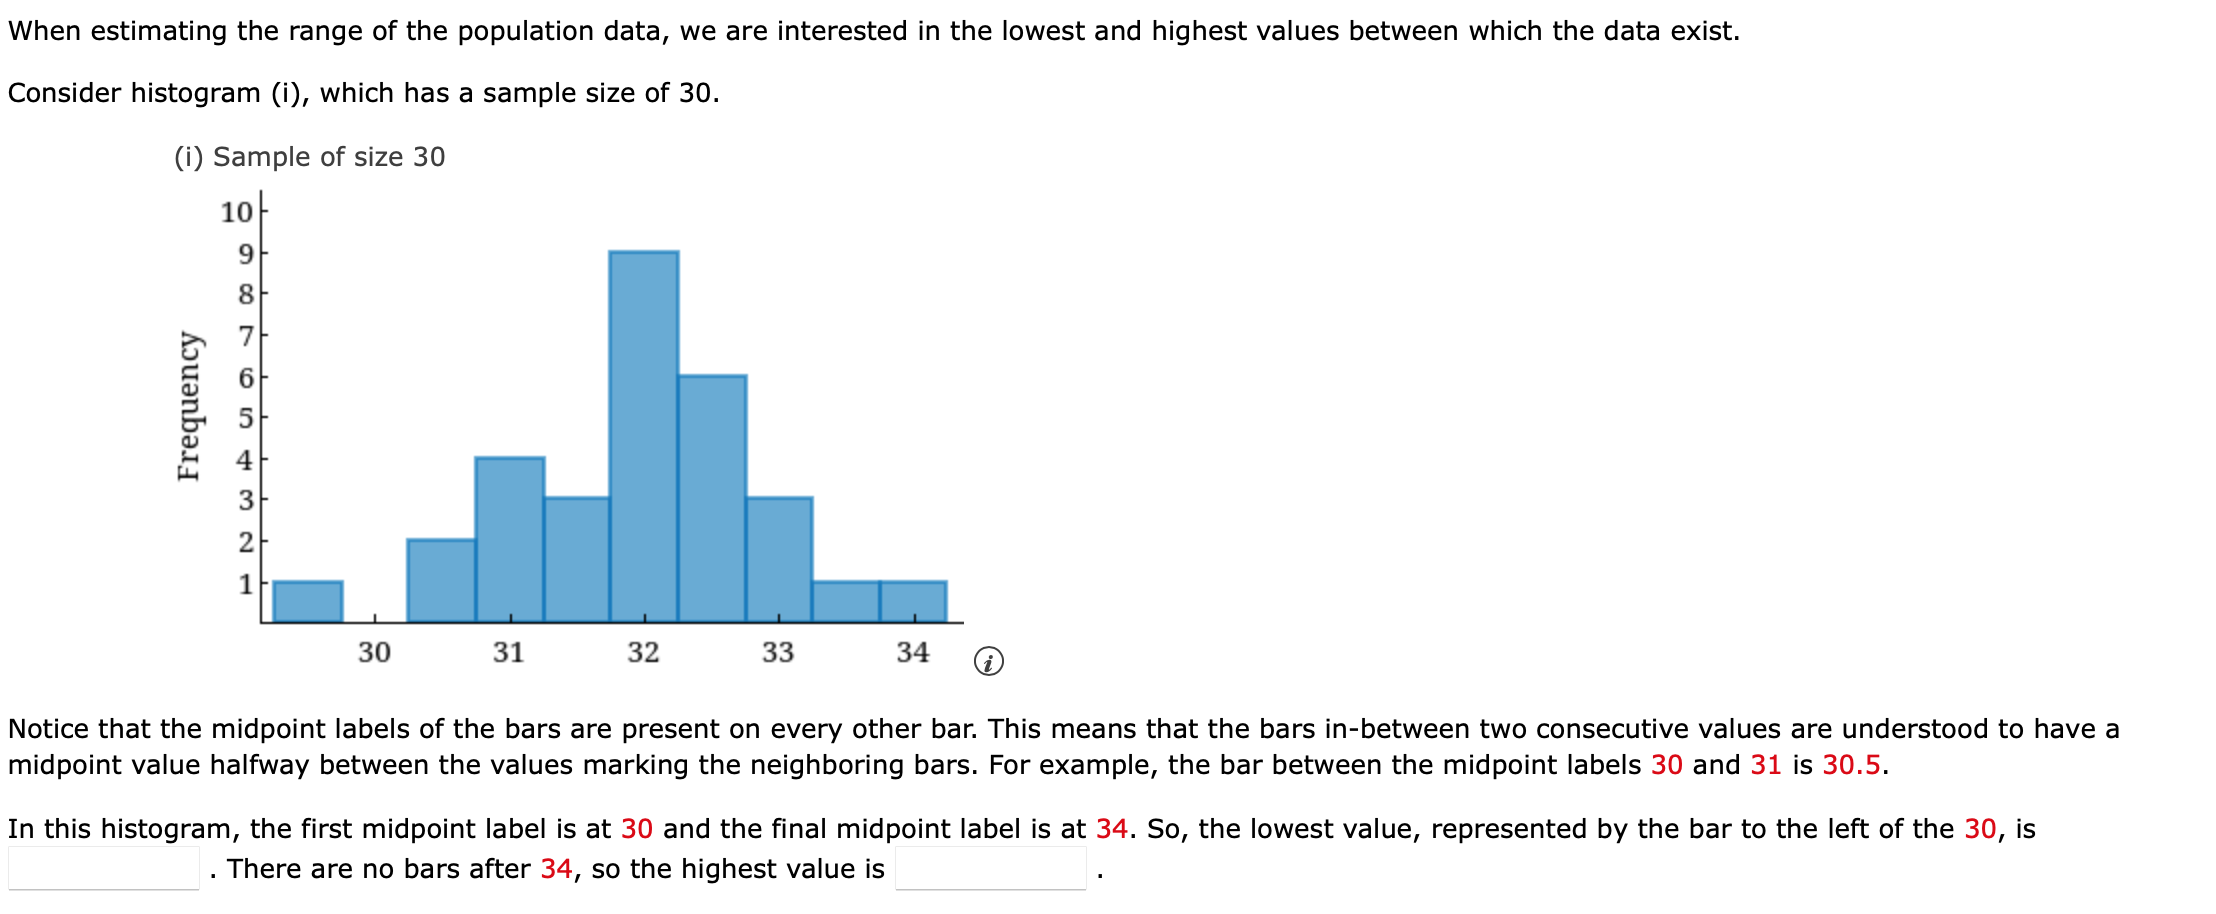
When estimating the range of the population data, we are interested in the lowest and highest values between which the data exist. Consider histogram (i), which has a sample size of 30. Votice that the midpoint labels of the bars are present on every other bar. This means that the bars in-between two consecutive values are understood to have a nidpoint value halfway between the values marking the neighboring bars. For example, the bar between the midpoint labels 30 and 31 is 30.5 . in this histogram, the first midpoint label is at 30 and the final midpoint label is at 34 . So, the lowest value, represented by the bar to the left of the 30 , is . There are no bars after 34 , so the highest value is
Expert Answer
In the given histogram...