Home /
Expert Answers /
Economics /
what-might-cause-the-change-shown-in-the-graph-figure-a-change-in-the-supply-curve-an-increase-i-pa835
(Solved): What might cause the change shown in the graph? Figure: A Change in the Supply Curve An increase i ...
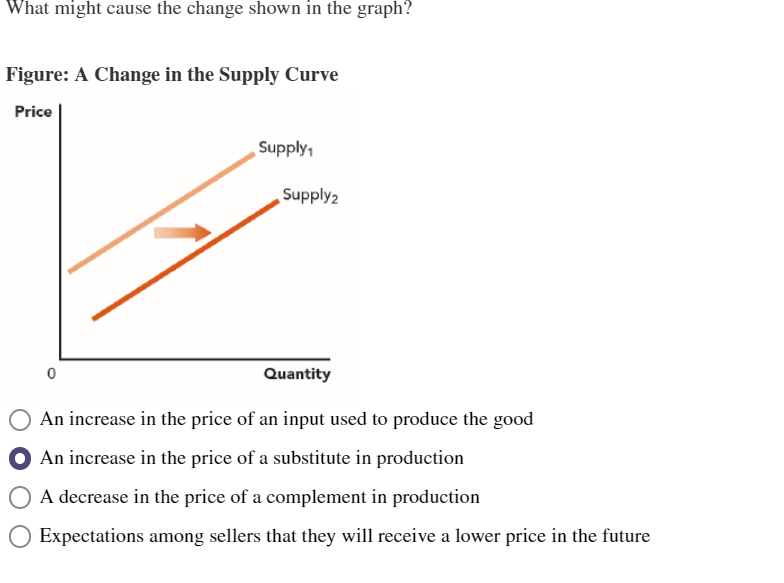
What might cause the change shown in the graph? Figure: A Change in the Supply Curve An increase in the price of an input used to produce the good An increase in the price of a substitute in production A decrease in the price of a complement in production Expectations among sellers that they will receive a lower price in the future
Expert Answer
Option D A rightward shift in supply curve occur when expectation among sellers that they will receive a lower pri