Home /
Expert Answers /
Calculus /
water-in-a-play-pool-the-graph-of-v-t-below-shows-the-amount-of-water-in-a-play-pool-as-tim-pa811
(Solved): Water in a Play Pool The graph of \( V(t) \) below shows the amount of water in a play pool as tim ...
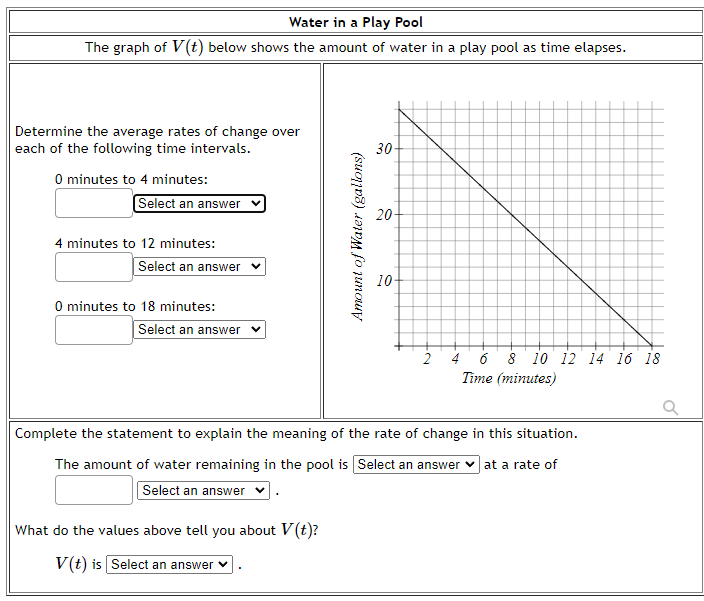
Water in a Play Pool The graph of \( V(t) \) below shows the amount of water in a play pool as time elapses. Determine the average rates of change over each of the following time intervals. 0 minutes to 4 minutes: 4 minutes to 12 minutes: 0 minutes to 18 minutes: Complete the statement to explain the meaning of the rate of change in this situation. The amount of water remaining in the pool is at a rate of What do the values above tell you about \( V(t) \) ? \( V(t) \) is