Home /
Expert Answers /
Advanced Math /
using-the-heaviside-function-u-t-write-down-a-function-y-t-that-represents-the-plot-below-you-ma-pa685
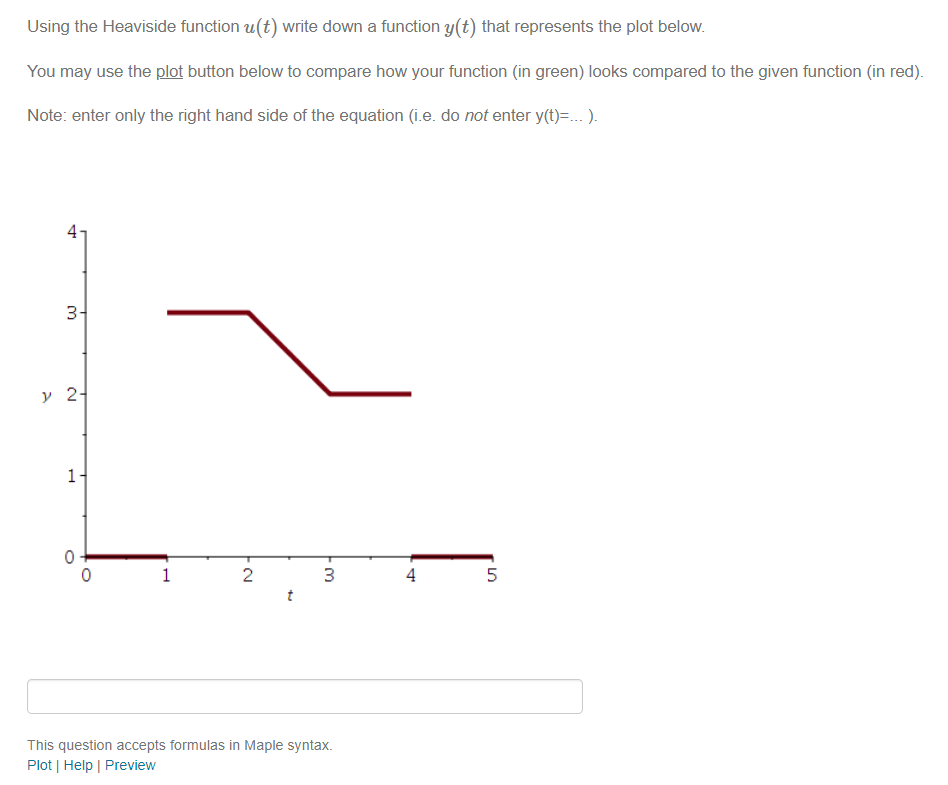
(Solved): Using the Heaviside function u(t) write down a function y(t) that represents the plot below. You ma ...
Using the Heaviside function
u(t)write down a function
y(t)that represents the plot below. You may use the plot button below to compare how your function (in green) looks compared to the given function (in red). Note: enter only the right hand side of the equation (i.e. do not enter
y(t)=dots). This question accepts formulas in Maple syntax. Plot | Help | Preview
