Home /
Expert Answers /
Electrical Engineering /
using-matlab-objective-to-implement-three-types-of-amplitude-modulation-a-pa475
(Solved): Using Matlab: Objective To implement three types of amplitude modulation: A ...
Using Matlab:

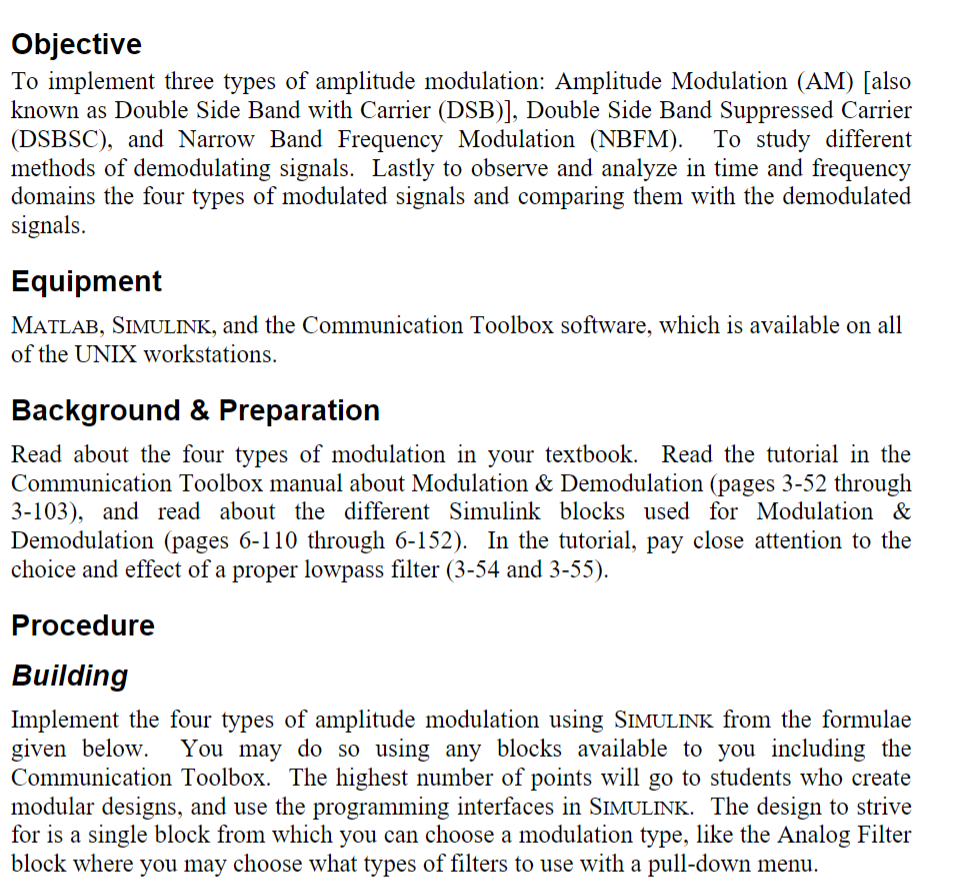
Objective To implement three types of amplitude modulation: Amplitude Modulation (AM) [also known as Double Side Band with Carrier (DSB)], Double Side Band Suppressed Carrier (DSBSC), and Narrow Band Frequency Modulation (NBFM). To study different methods of demodulating signals. Lastly to observe and analyze in time and frequency domains the four types of modulated signals and comparing them with the demodulated signals. Equipment MATLAB, SIMULINK, and the Communication Toolbox software, which is available on all of the UNIX workstations. Background & Preparation Read about the four types of modulation in your textbook. Read the tutorial in the Communication Toolbox manual about Modulation & Demodulation (pages 3-52 through 3-103), and read about the different Simulink blocks used for Modulation & Demodulation (pages 6-110 through 6-152). In the tutorial, pay close attention to the choice and effect of a proper lowpass filter (3-54 and 3-55). Procedure Building Implement the four types of amplitude modulation using SIMULINK from the formulae given below. You may do so using any blocks available to you including the Communication Toolbox. The highest number of points will go to students who create modular designs, and use the programming interfaces in SIMULINK. The design to strive for is a single block from which you can choose a modulation type, like the Analog Filter block where you may choose what types of filters to use with a pull-down menu.
AM s(t)=Ac[1+ Amm(t)] sin (27fct) s(t) is the output signal. Ac is the amplitude of the sinusoidal carrier. Am is the amplitude of the message signal. m(t) is the message signal. DSBSC s(t)=AcAmm(t) sin (27fct) s(t) is the output signal. Ac is the amplitude of the sinusoidal carrier. Am is the amplitude of the message signal. m(t) is the message signal.
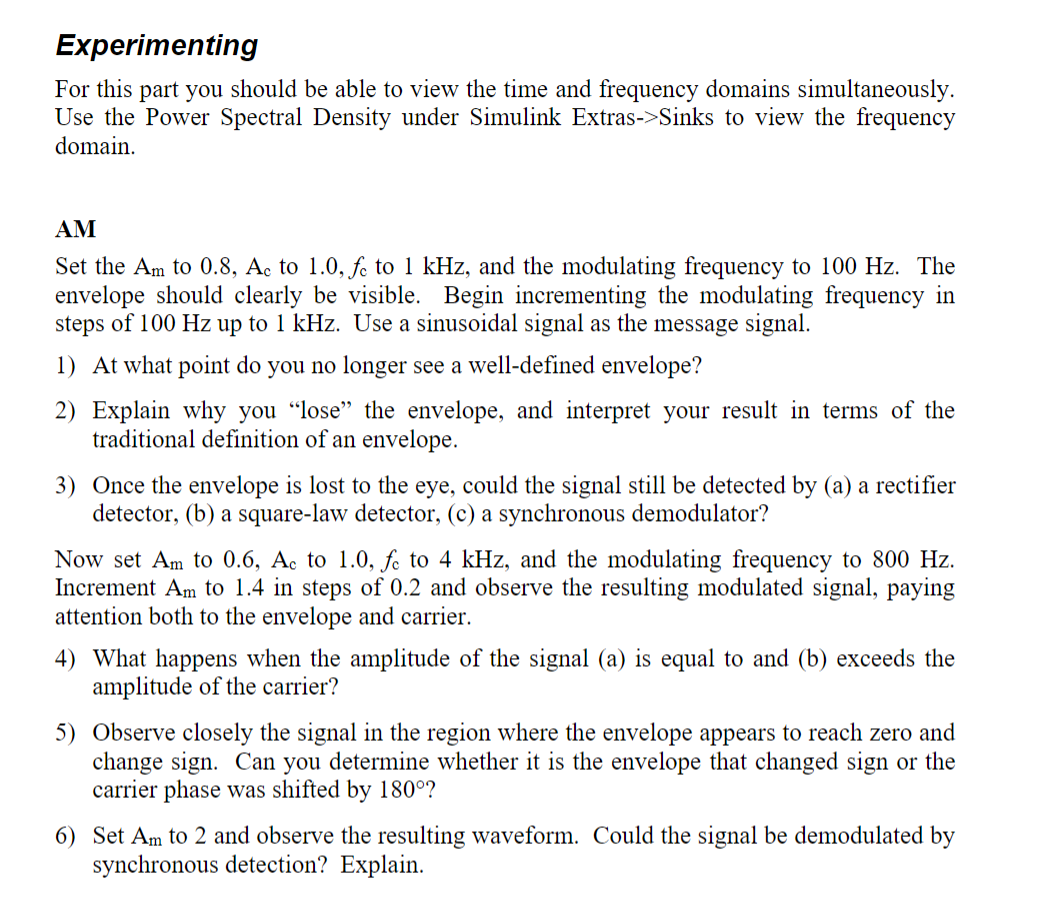
Experimenting For this part you should be able to view the time and frequency domains simultaneously. Use the Power Spectral Density under Simulink Extras->Sinks to view the frequency domain. AM Set the Am to 0.8, Ac to 1.0, fe to 1 kHz, and the modulating frequency to 100 Hz. The envelope should clearly be visible. Begin incrementing the modulating frequency in steps of 100 Hz up to 1 kHz. Use a sinusoidal signal as the message signal. 1) At what point do you no longer see a well-defined envelope? 2) Explain why you "lose" the envelope, and interpret your result in terms of the traditional definition of an envelope. 3) Once the envelope is lost to the eye, could the signal still be detected by (a) a rectifier detector, (b) a square-law detector, (c) a synchronous demodulator? Now set Am to 0.6, Ac to 1.0, fe to 4 kHz, and the modulating frequency to 800 Hz. Increment Am to 1.4 in steps of 0.2 and observe the resulting modulated signal, paying attention both to the envelope and carrier. 4) What happens when the amplitude of the signal (a) is equal to and (b) exceeds the amplitude of the carrier? 5) Observe closely the signal in the region where the envelope appears to reach zero and change sign. Can you determine whether it is the envelope that changed sign or the carrier phase was shifted by 180°? 6) Set Am to 2 and observe the resulting waveform. Could the signal be demodulated by synchronous detection? Explain.
DSBSC Set Am to 0.6, Ac to 1.0, fe to 1 kHz, and the modulating frequency to 20 Hz. Use a square wave as the message signal. 7) What is the envelope like? Where in the modulated signal can you see evidence of the square wave? How would you demodulate it? 8) How does the spectrum of the modulated signal relate to that modulating signal? 9) Set the square wave frequency to 200 Hz and compare the original and modulated spectra. Explain what changes the frequency increase caused.
Expert Answer
MatLab Code: %% AM: %Case 1: Am = 0.8; Ac = 1; fc = 1e3; fm = 1e2; Fs = 1e5; Ts = 1/Fs; t = 0:Ts:0.05; mt = sin(2*pi*fm*t); s1 = Ac*(1+Am*mt).*sin(2*pi*fc*t); figure(1) plot(t,s1) titl

![AM
s(t)=Ac[1+ Amm(t)] sin (27fct)
s(t) is the output signal. Ac is the amplitude of the sinusoidal carrier. Am is the amplitu](https://media.cheggcdn.com/media/a63/a63d351d-2192-4dcf-9dfb-9518470a6b90/phpvs0OdN)
