Home /
Expert Answers /
Calculus /
use-the-graph-below-to-find-the-limit-as-x-approaches-3-use-the-graph-below-to-answer-the-ques-pa770
(Solved): Use the graph below to find the limit as x approaches 3. Use the graph below to answer the ques ...
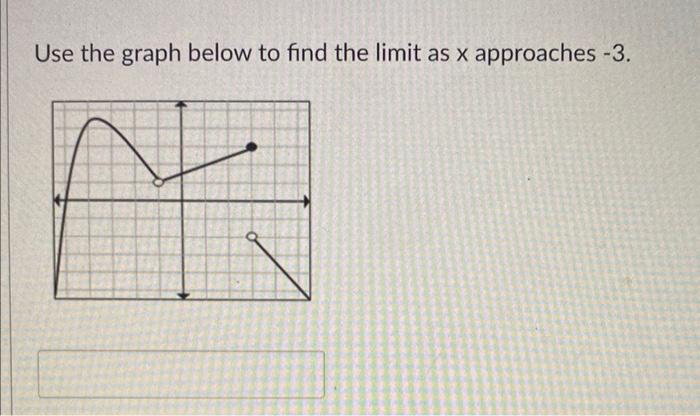
Use the graph below to find the limit as approaches .
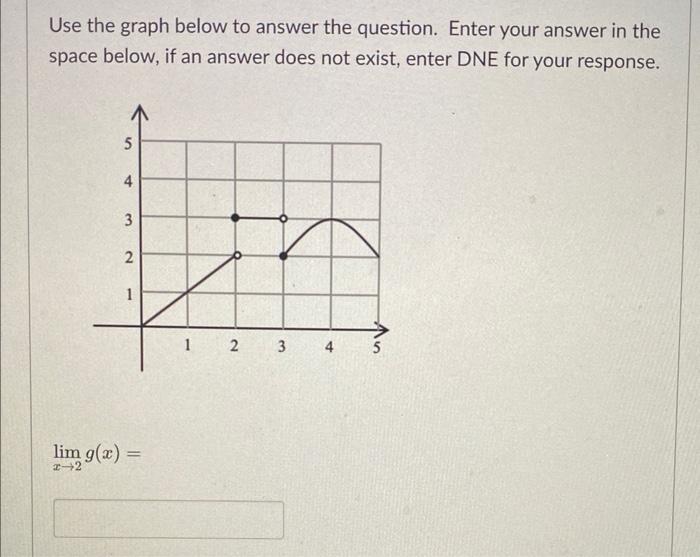
Use the graph below to answer the question. Enter your answer in the space below, if an answer does not exist, enter DNE for your response.
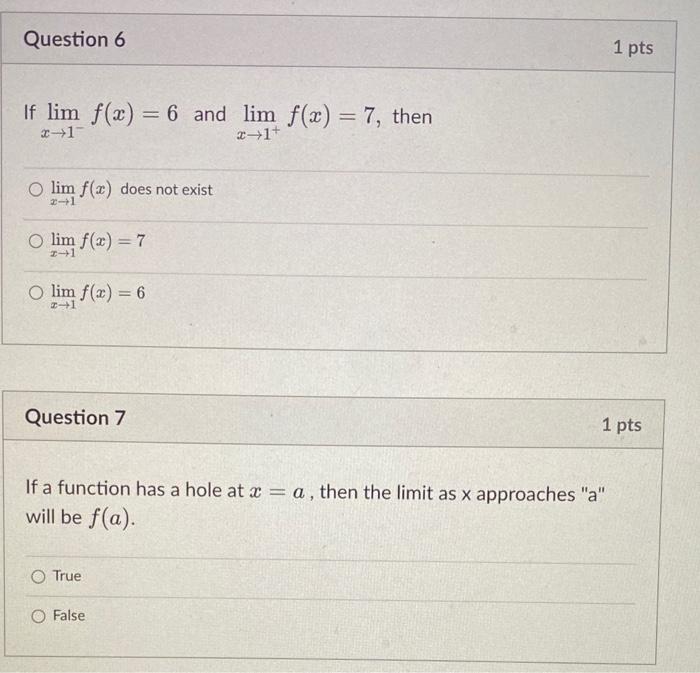
If and , then does not exist Question 7 If a function has a hole at , then the limit as approaches "a" will be True False
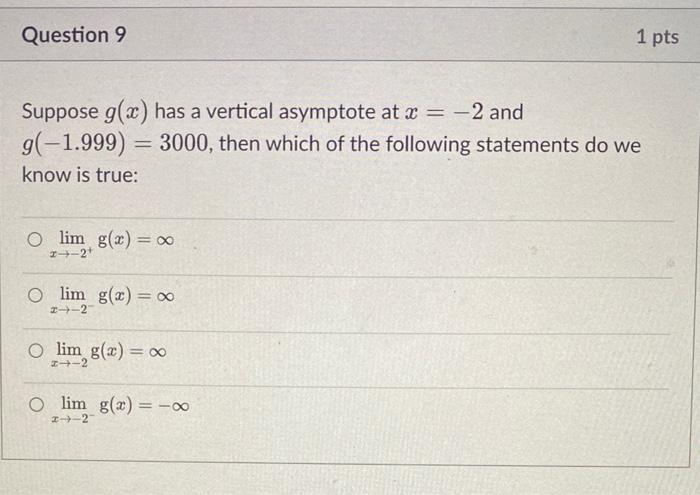
Suppose has a vertical asymptote at and , then which of the following statements do we know is true:
Expert Answer
1. use the graph we get, the limit as x approaches -3 is 4.2. here, we get, limx