Home /
Expert Answers /
Statistics and Probability /
use-a-standard-normal-table-to-obtain-the-areas-under-the-normal-curve-described-below-sketch-a-s-pa763
(Solved): Use a standard normal table to obtain the areas under the normal curve described below. Sketch a s ...
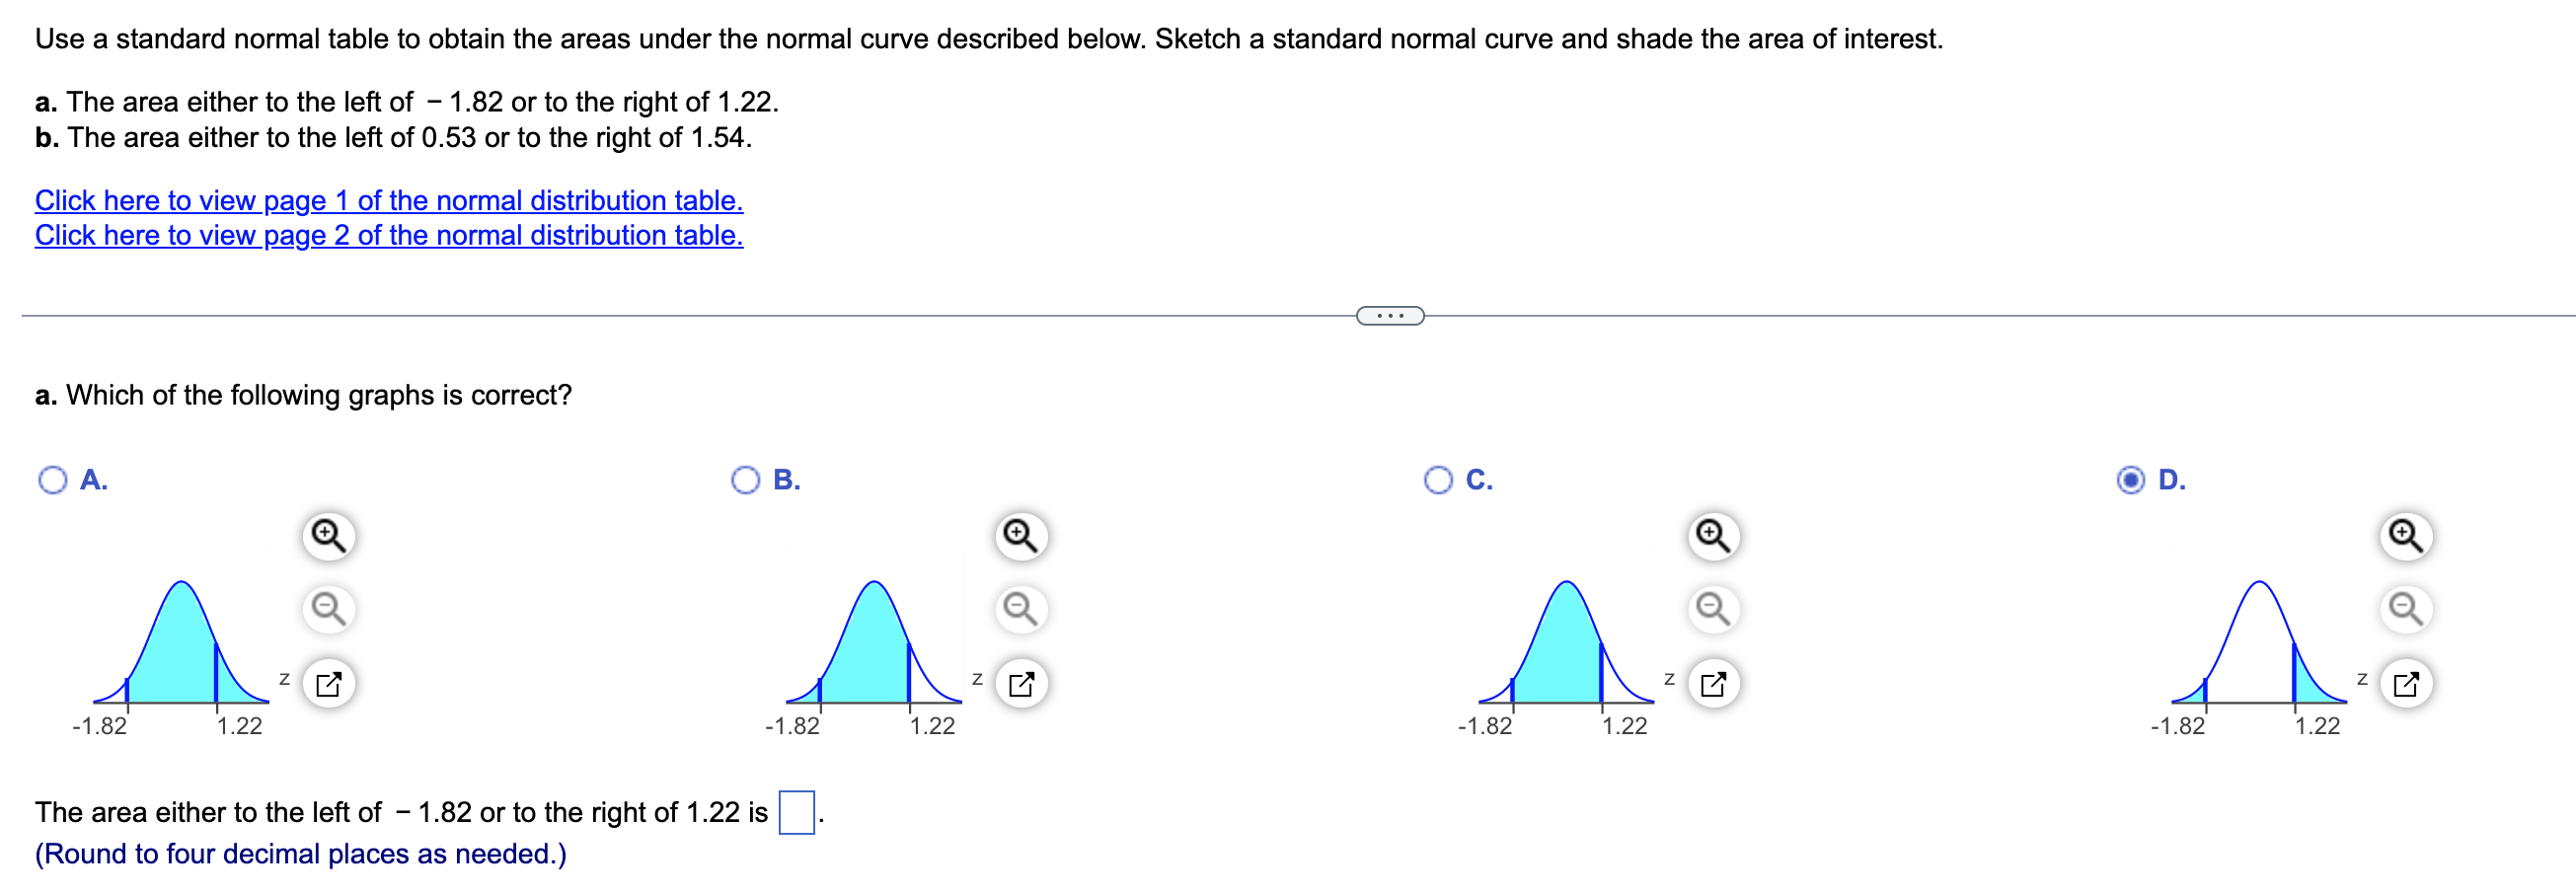

Use a standard normal table to obtain the areas under the normal curve described below. Sketch a standard normal curve and shade the area of interest. a. The area either to the left of - 1.82 or to the right of 1.22. b. The area either to the left of 0.53 or to the right of 1.54. Click here to view page 1 of the normal distribution table. Click here to view page 2 of the normal distribution table. a. Which of the following graphs is correct? O A. -1.82 1.22 Z O B. -1.82 The area either to the left of - 1.82 or to the right of 1.22 is (Round to four decimal places as needed.) 1.22 N N O C. -1.82 1.22 Z D. -1.82 1.22 ZG
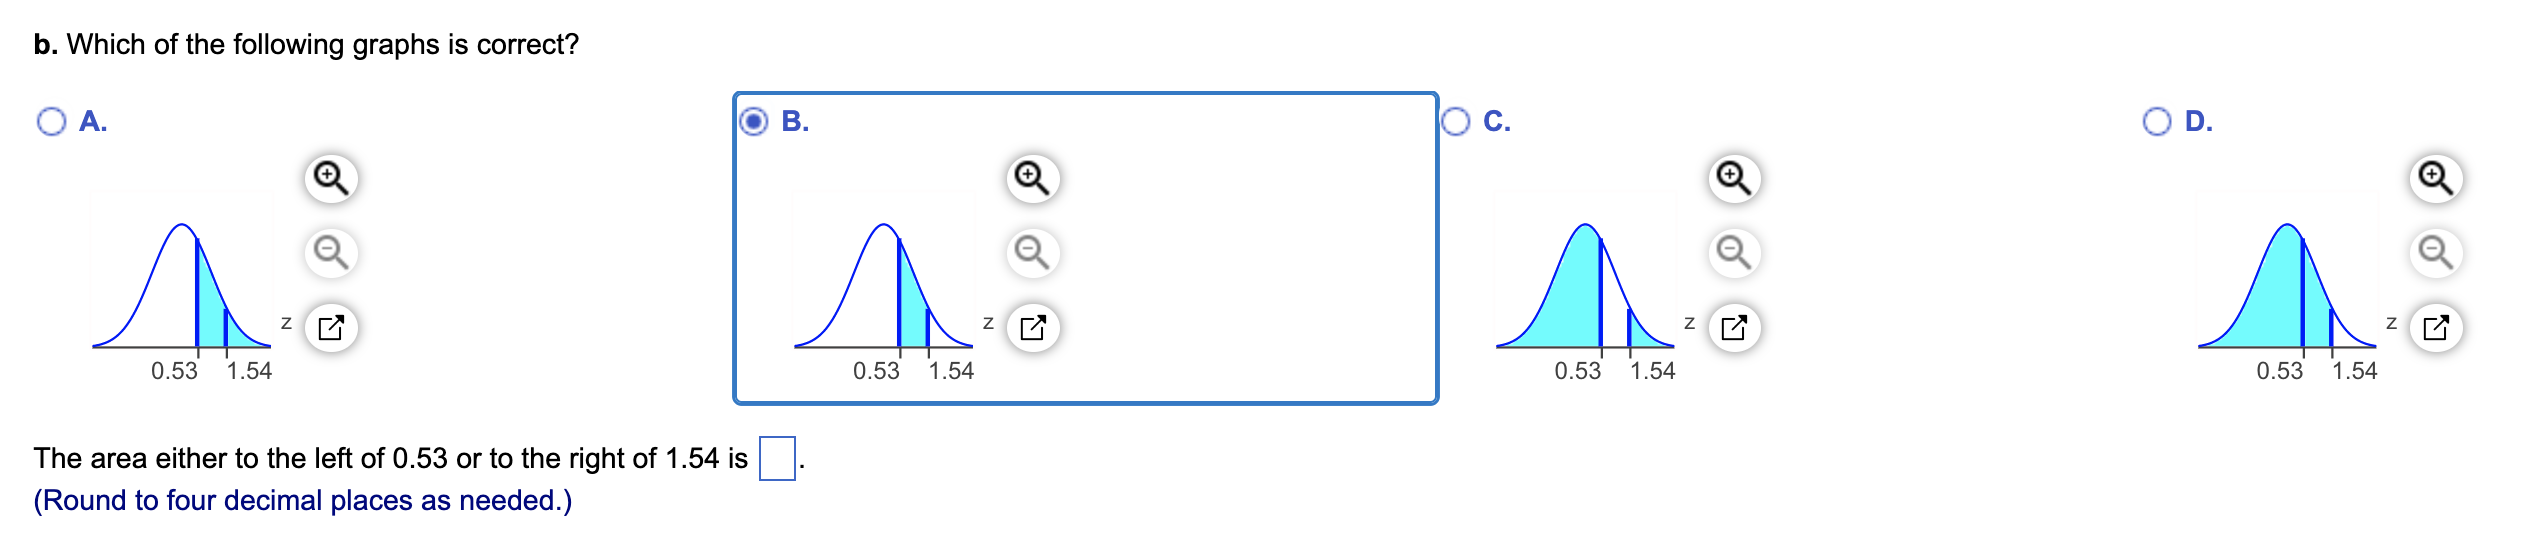
b. Which of the following graphs is correct? O A. s 0.53 1.54 Z The area either to the left of 0.53 or to the right of 1.54 is (Round to four decimal places as needed.) B. 0.53 1.54 Z O C. 0.53 1.54 Z D. 0.53 1.54 z?
Based on a recent study, the pH level of the arterial cord (one vessel in the umbilical cord) is normally distributed with mean 7.35 and standard deviation of 0.14. Find the percentage of preterm infants who have the following arterial cord pH levels. a. pH levels between 7.00 and 7.50. b. pH levels over 7.43. Click here to view page 1 of the standard normal distribution table. Click here to view page 2 of the standard normal distribution table. a. The percentage of arterial cord pH levels that are between 7.00 and 7.50 is (Round to two decimal places as needed.) b. The percentage of arterial cord pH levels that are over 7.43 is (Round to two decimal places as needed.) %. %.
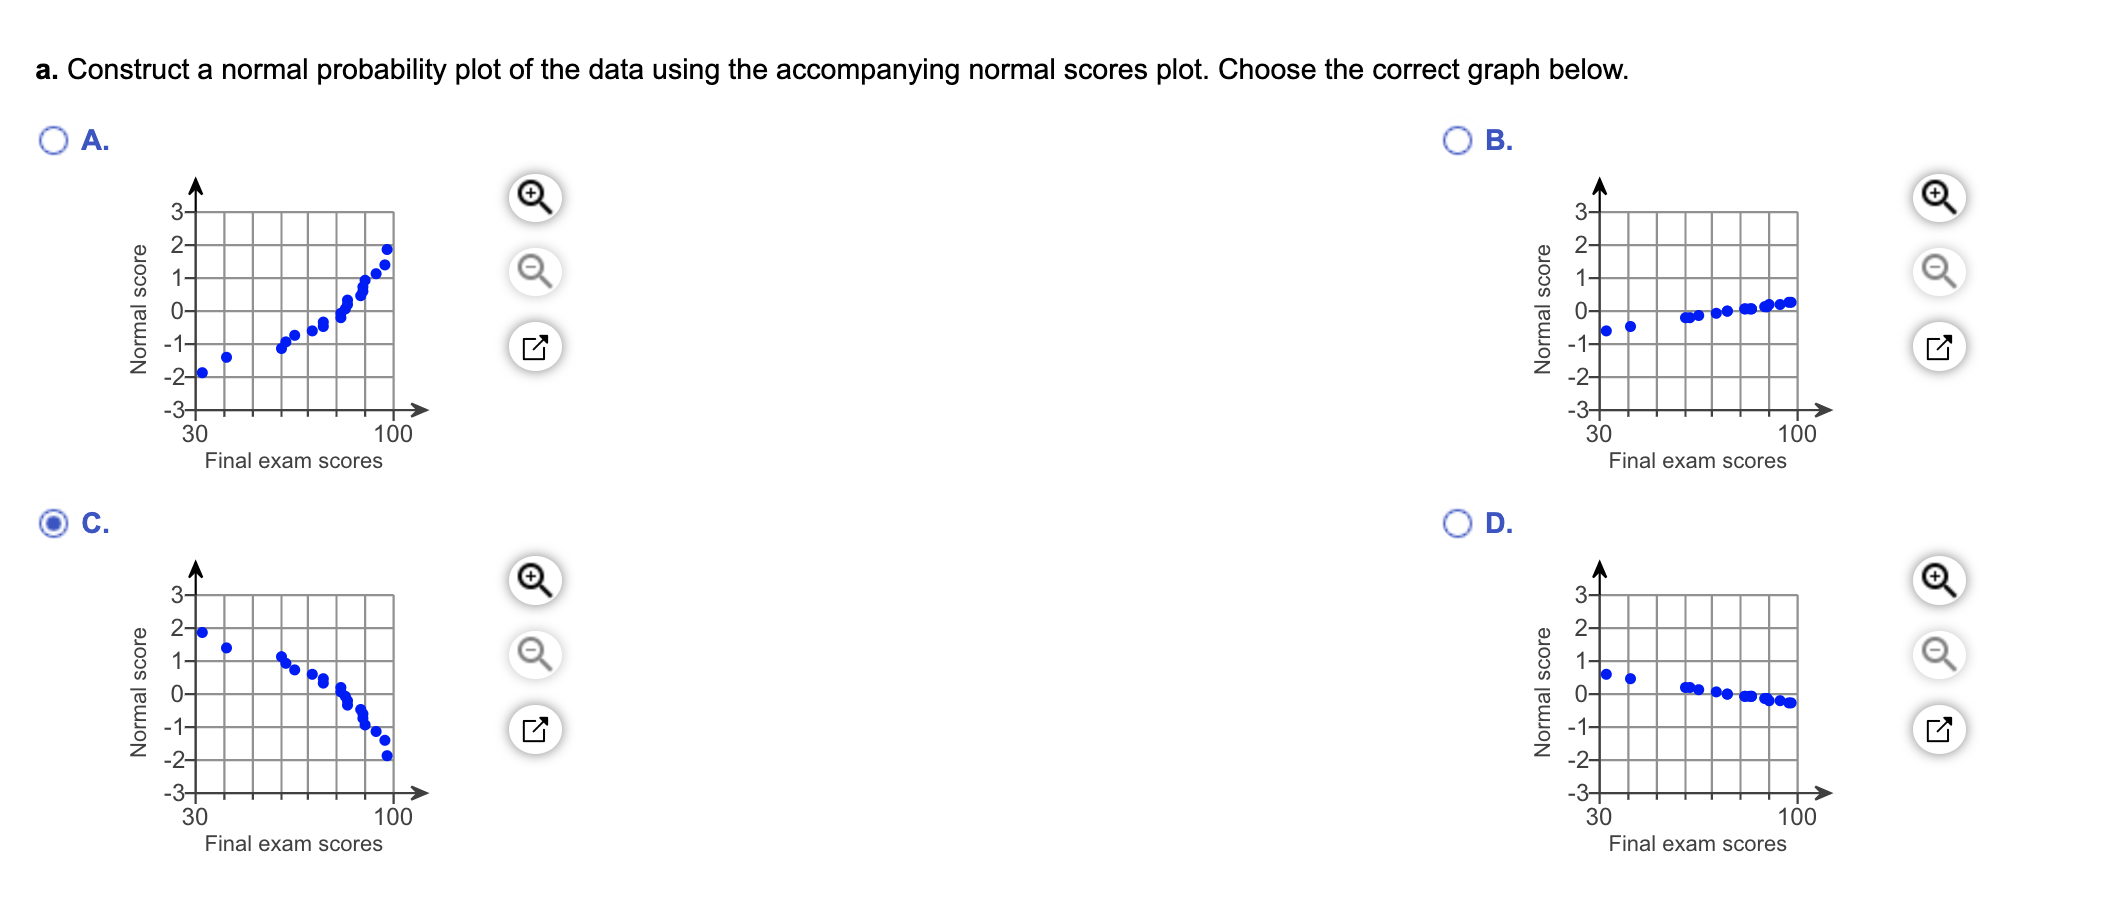
A sample of the final exam scores in a large introductory statistics course are shown in the accompanying table. Answer parts (a) through (c) below.
a. Construct a normal probability plot of the data using the accompanying normal scores plot. Choose the correct graph below. O B. A. C. Normal score Normal score A 3- 2- -3+ 30 6 + 2 100 Final exam scores 30 NE 100 N Final exam scores N O D. Normal score Normal score 3- = ?? -3+ 30 Final exam scores - 6 c -2- -3- ? 30 8 8 8 8 100 100 Final exam scores N
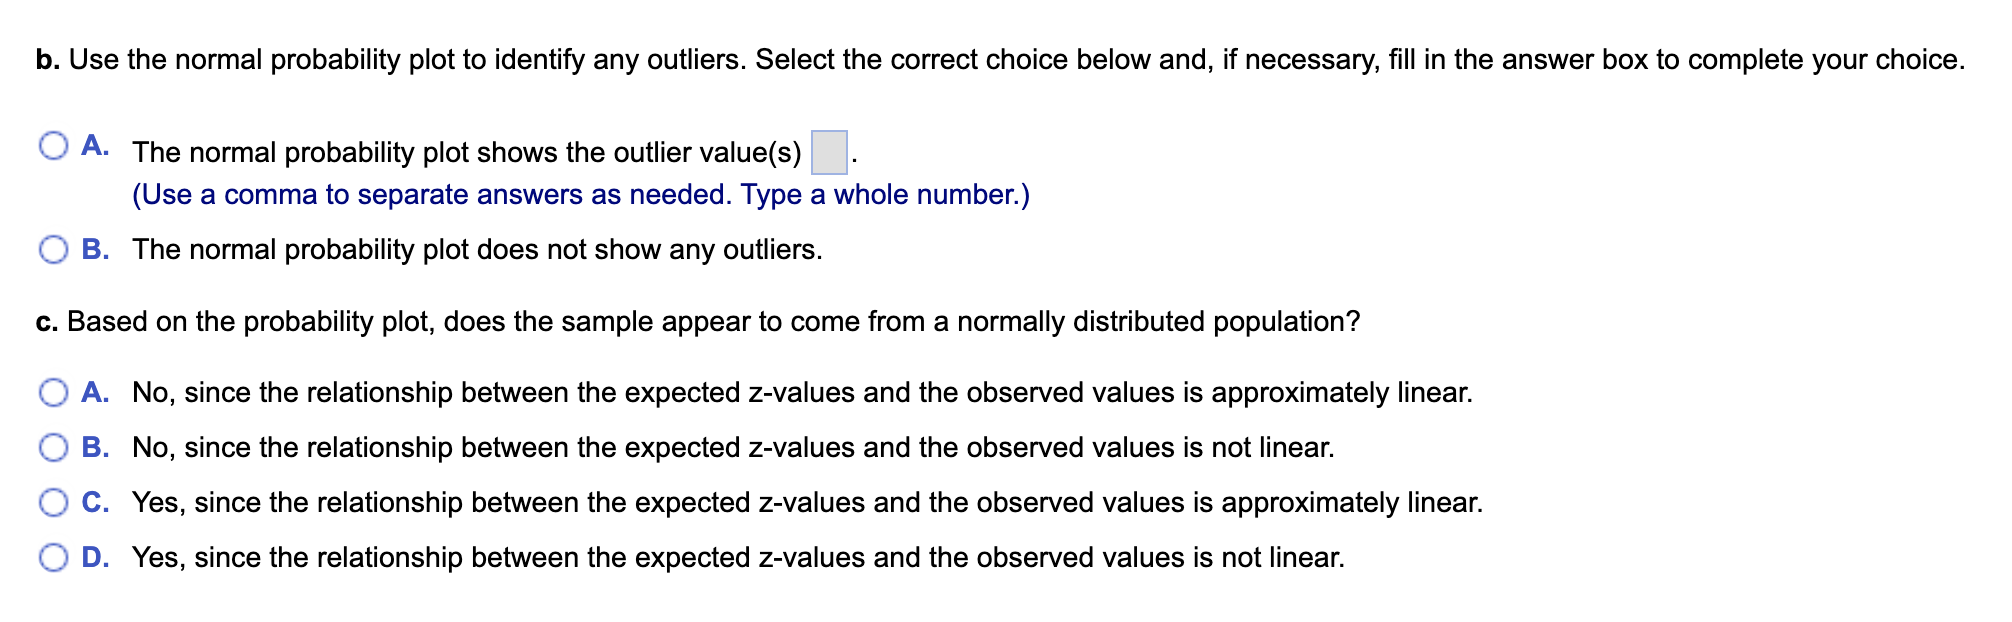
b. Use the normal probability plot to identify any outliers. Select the correct choice below and, if necessary, fill in the answer box to complete your choice. O A. The normal probability plot shows the outlier value(s) (Use a comma to separate answers as needed. Type a whole number.) B. The normal probability plot does not show any outliers. c. Based on the probability plot, does the sample appear to come from a normally distributed population? A. No, since the relationship between the expected z-values and the observed values is approximately linear. B. No, since the relationship between the expected z-values and the observed values is not linear. C. Yes, since the relationship between the expected z-values and the observed values is approximately linear. D. Yes, since the relationship between the expected z-values and the observed values is not linear.
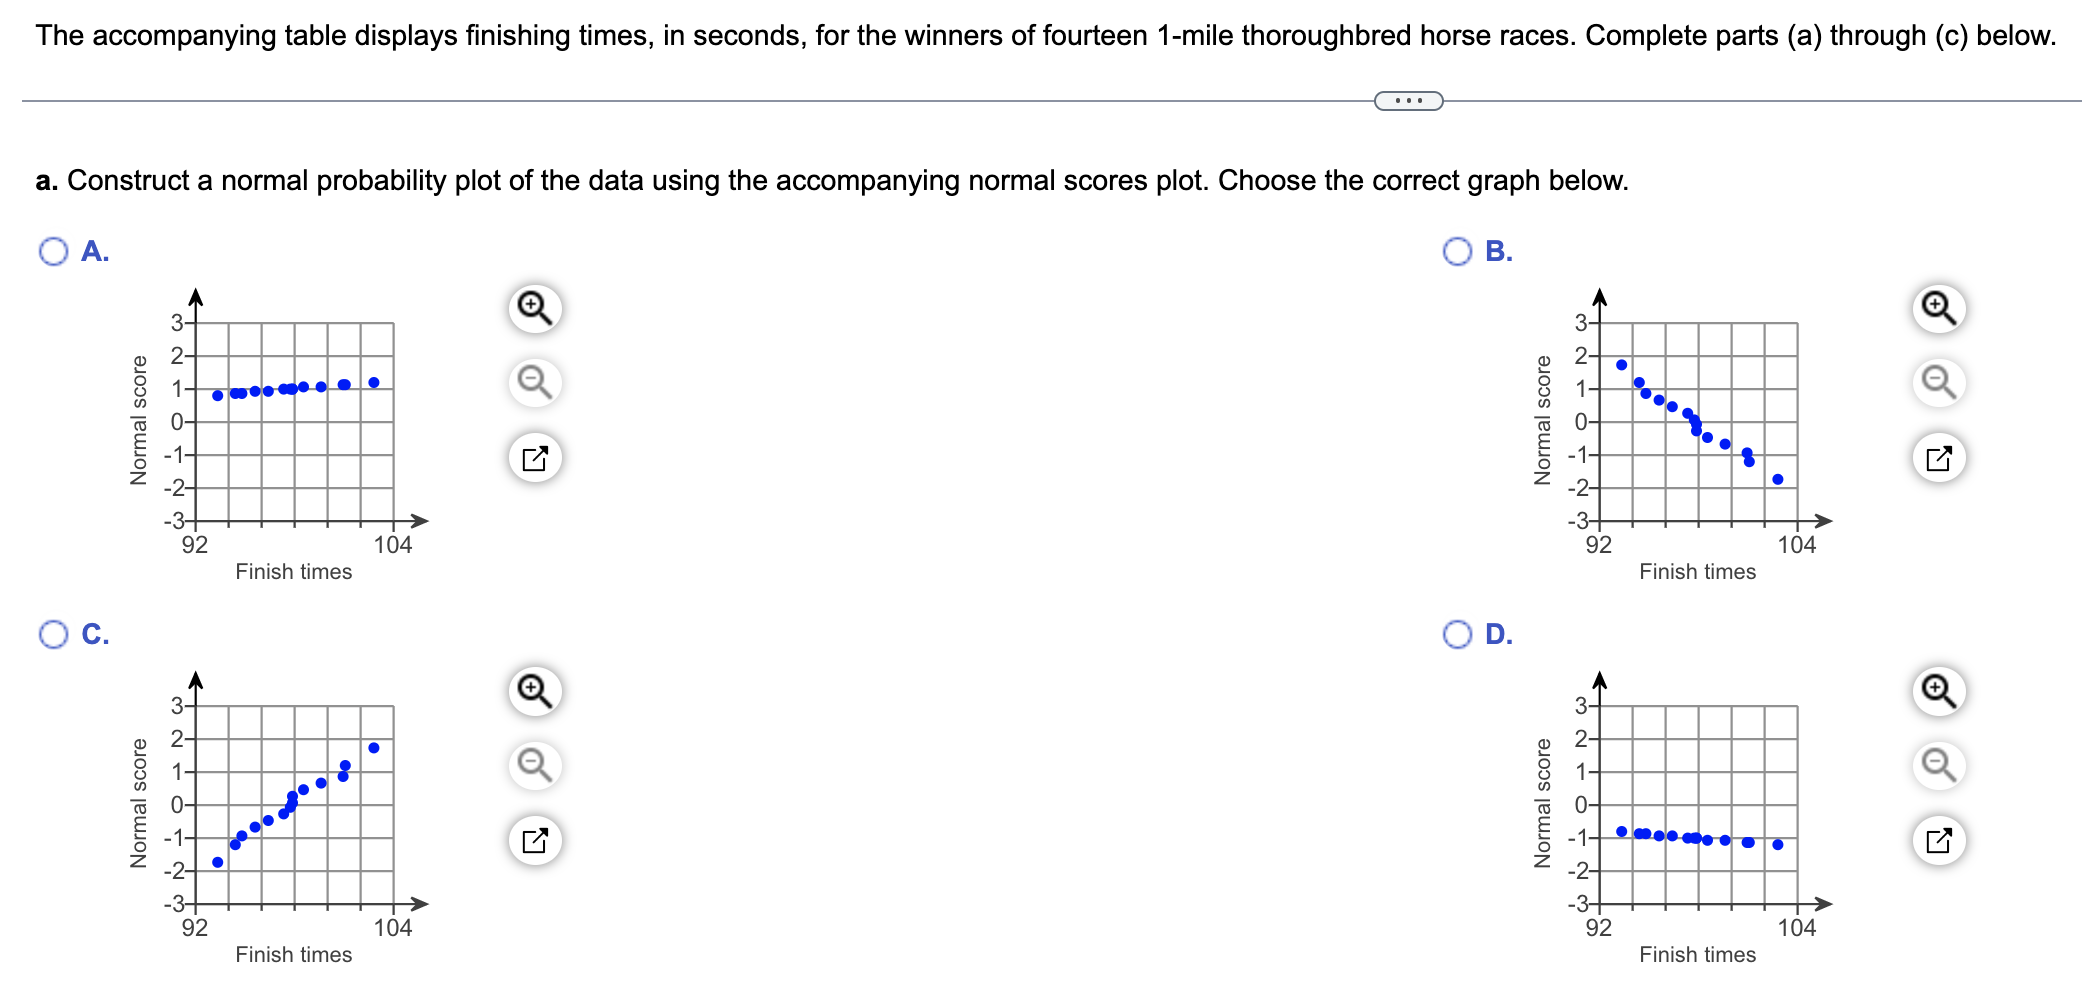
The accompanying table displays finishing times, in seconds, for the winners of fourteen 1-mile thoroughbred horse races. Complete parts (a) through (c) below. a. Construct a normal probability plot of the data using the accompanying normal scores plot. Choose the correct graph below. A. C. Normal score Normal score -2- 92 3- 92 ? Finish times Finish times ? 104 104 LY 17 B. O D. Normal score Normal score -2+ -3+ 92 3- & 2- 1- -2- -3+ 92 Finish times Finish times ? 104 104 N
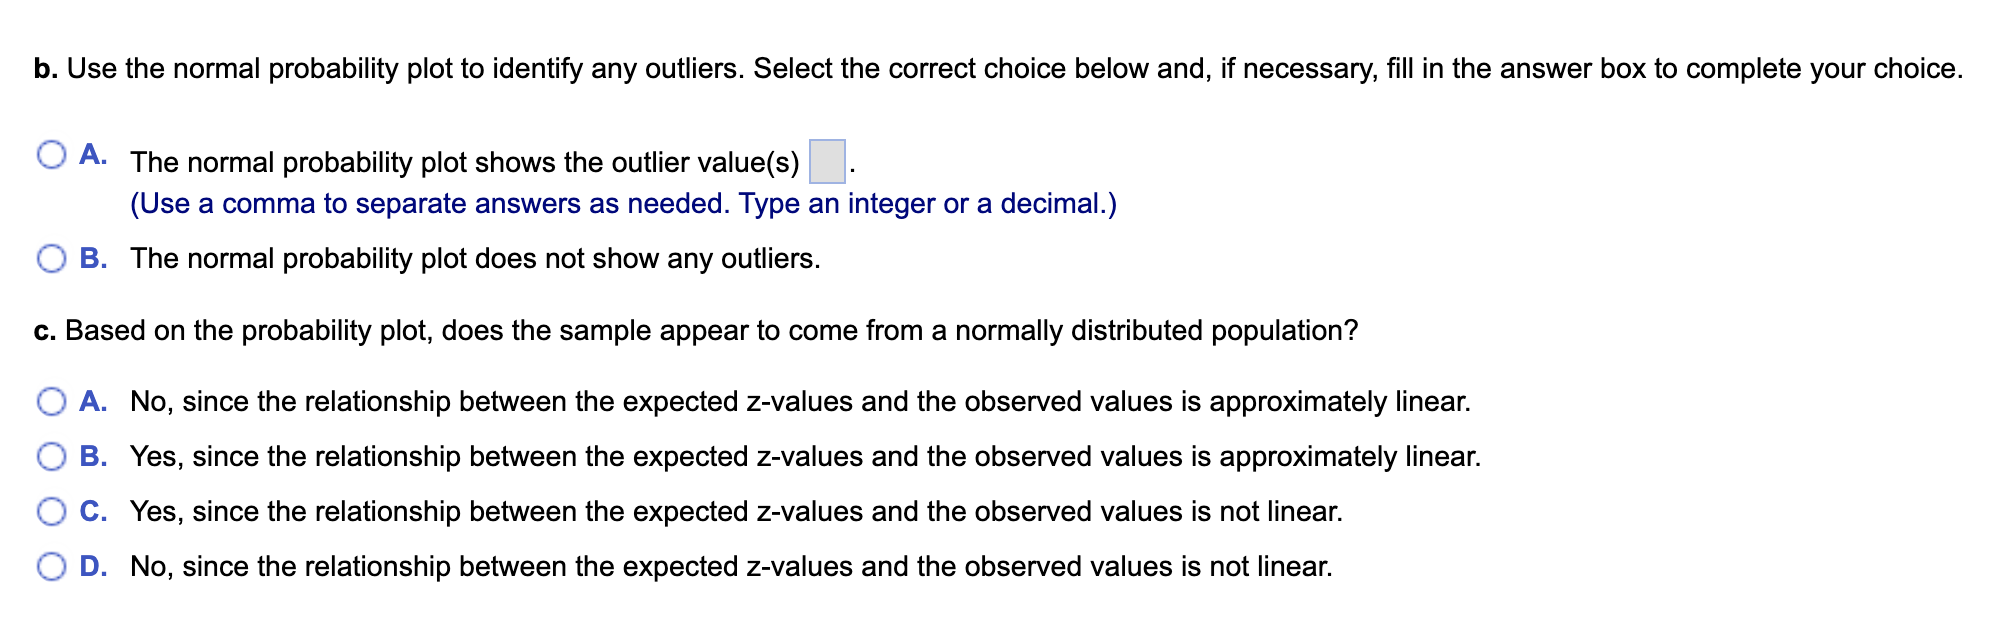
b. Use the normal probability plot to identify any outliers. Select the correct choice below and, if necessary, fill in the answer box to complete your choice. A. The normal probability plot shows the outlier value(s) (Use a comma to separate answers as needed. Type an integer or a decimal.) B. The normal probability plot does not show any outliers. c. Based on the probability plot, does the sample appear to come from a normally distributed population? A. No, since the relationship between the expected z-values and the observed values is approximately linear. B. Yes, since the relationship between the expected z-values and the observed values is approximately linear. C. Yes, since the relationship between the expected z-values and the observed values is not linear. D. No, since the relationship between the expected z-values and the observed values is not linear.