Home /
Expert Answers /
Statistics and Probability /
this-table-shows-the-distribution-of-winning-times-in-the-kentucky-derby-a-horse-race-over-87-ye-pa499
(Solved): This table shows the distribution of winning times in the Kentucky Derby (a horse race) over 87 ye ...
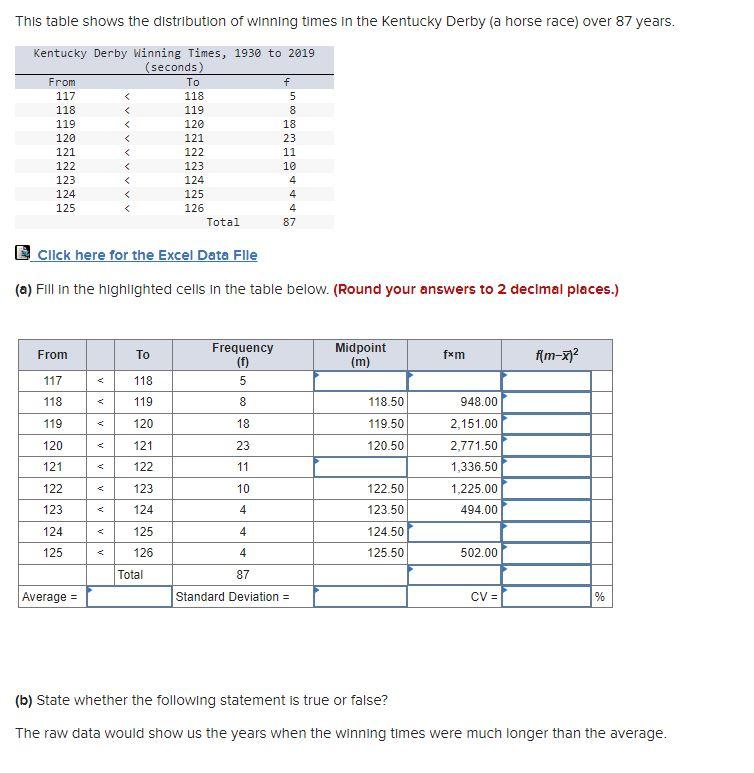
This table shows the distribution of winning times in the Kentucky Derby (a horse race) over 87 years. Q cllck here for the Excel Data Flle (a) Fill in the highlighted cells in the table below. (Round your answers to 2 decimal places.) (b) State whether the following statement is true or false? The raw data would show us the years when the winning times were much longer than the average.
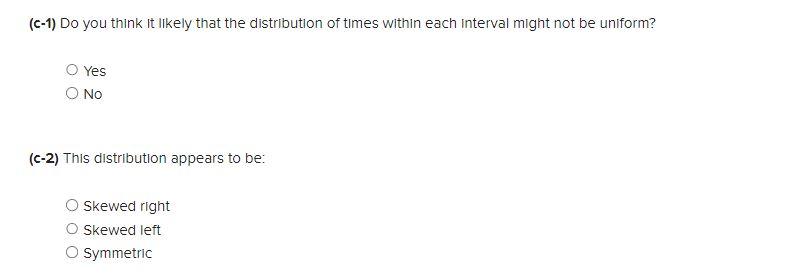
\( (c-1) \) Do you think it likely that the distribution of times within each interval might not be uniform? Yes No (c-2) This distribution appears to be: Skewed right Skewed left Symmetric

