Home /
Expert Answers /
Operations Management /
this-is-all-one-question-nbsp-refer-to-cables6-1-factorstor-comoutino-contro-chantilimis-13-sioma-pa116
(Solved): this is all one question Refer to Cables6.1-Factorstor Comoutino Contro) Chantilimis 13 sioma ...
this is all one question
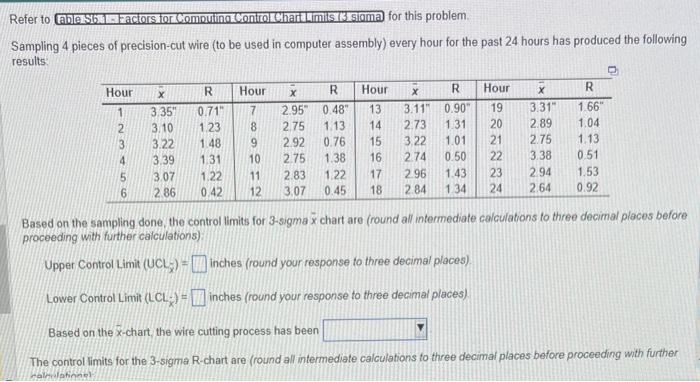
Refer to Cables6.1-Factorstor Comoutino Contro) Chantilimis 13 sioma for this problem. Sampling 4 pieces of precision-cut wire (to be used in computer assembly) every hour for the past 24 hours has produced the following results. Based on the sampling done, the control limits for 3-sigma \( \bar{x} \) chart are (round all intermediate calculations to three decimal places before proceeding with further calculations): Upper Control Limit (UCL U \( _{\bar{X}}= \) inches (round your response to three decimal places). Lower Control Limit \( \left(\mathrm{LCL}_{\bar{X}}\right)= \) inches (round your response to three decimal places) Based on the \( \bar{x} \)-chart, the wire cutting process has been The control limits for the 3-sigma R-chart are (round all intermediate calculations to three decimal places before proceeding with further Hallavetionin?
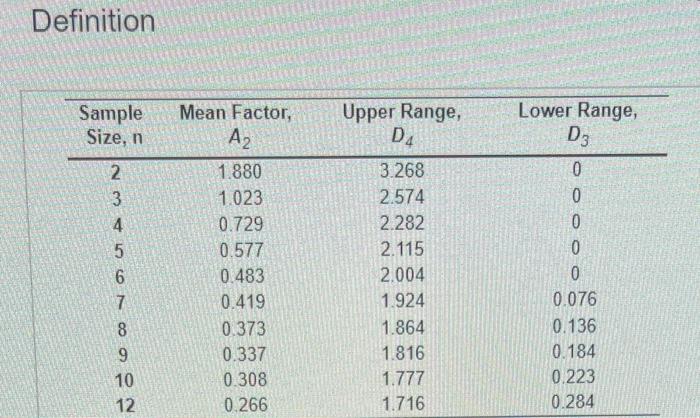
Definition
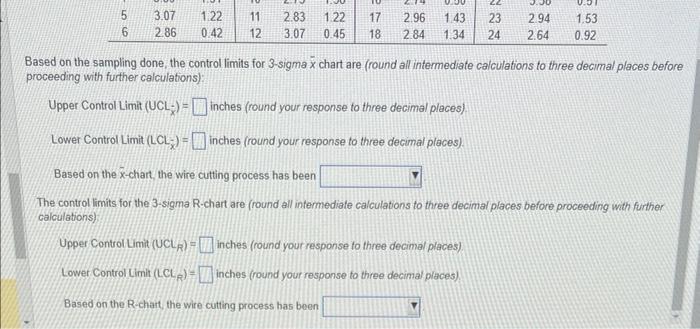
Based on the sampling done, the control limits for 3 -sigma \( \bar{x} \) chart are (round all intermediate calculations to three decimal places before proceeding with further calculations): Upper Control Limit \( \left(\mathrm{UCL}_{\dot{X}}\right)= \) inches (round your response to three decimal places). Lower Control Limit \( \left(\mathrm{LCL}_{-}\right)= \)inches (round your response to three decimal places). Based on the \( \bar{x} \)-chart, the wire cutting process has been The control limits for the 3-sigma R-chart are (round all intermediate calculations to three decimal places before proceeding with further calculations) Upper Control Limit \( \left(U C L_{R}\right)= \) inches (round your response to three decima/ places) Lower Control Limit \( \left(\mathrm{LCL}_{R}\right)= \) inches (round your response to three decimal places) Based on the R-chart, the wire cutting process has been
Expert Answer
Steps to follow : We will establish Xdouble bar which is average of all values of xbar We will establish Rdouble bar which is