Home /
Expert Answers /
Earth Sciences /
this-exercise-examines-six-climographs-of-six-cities-identified-on-the-map-below-like-all-climograp-pa191
(Solved): This exercise examines six Climographs of six cities identified on the map below. Like all Climograp ...
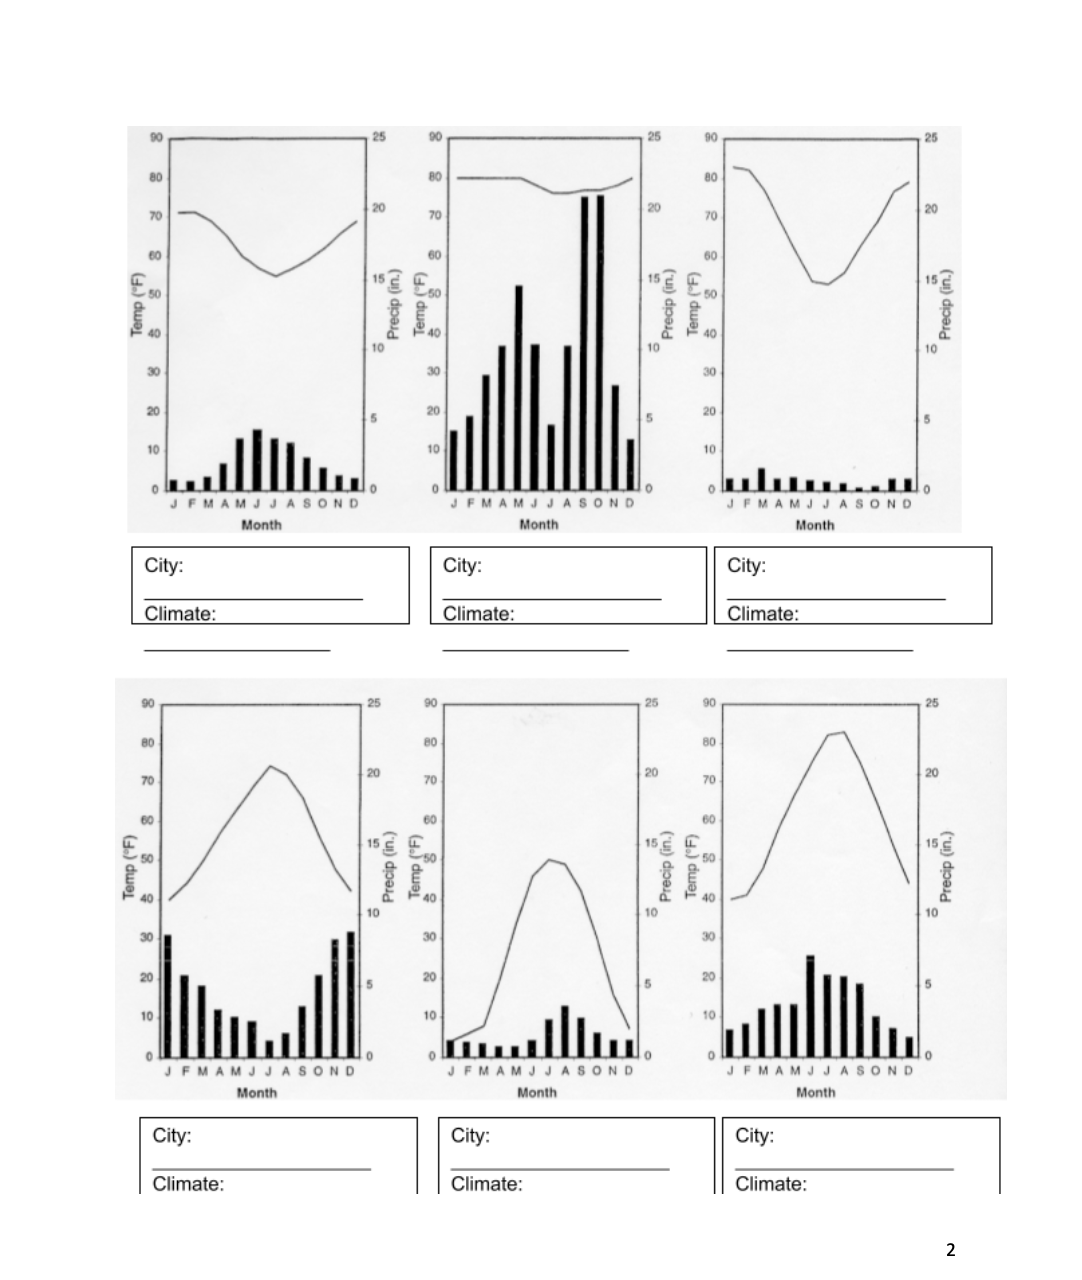
This exercise examines six Climographs of six cities identified on the map below. Like all Climographs, these show the variation of temperature and precipitation through the year for the six cities. We will apply our understanding of climate processes and distribution in trying to determine which of the Climographs would best suit the cities shown in the map below, and more specifically, the climate type that it represents.
There are six different climate types represented in this exercise:
Tropical Wet
Subtropical Desert
Mediterranean
Humid Subtropical
Marine West Coast
Polar

City: Climate: City: Climate: 2