Home /
Expert Answers /
Physics /
these-questions-deal-with-blackbodies-this-graph-shows-intensity-y-axis-vs-wavelength-x-axis-fo-pa945
(Solved): These questions deal with blackbodies. This graph shows intensity (y-axis) vs wavelength (x-axis) fo ...
These questions deal with blackbodies. This graph shows intensity (y-axis) vs wavelength (x-axis) for light from an object. This
type of graph is called a blackbody or thermal radiation spectrum.
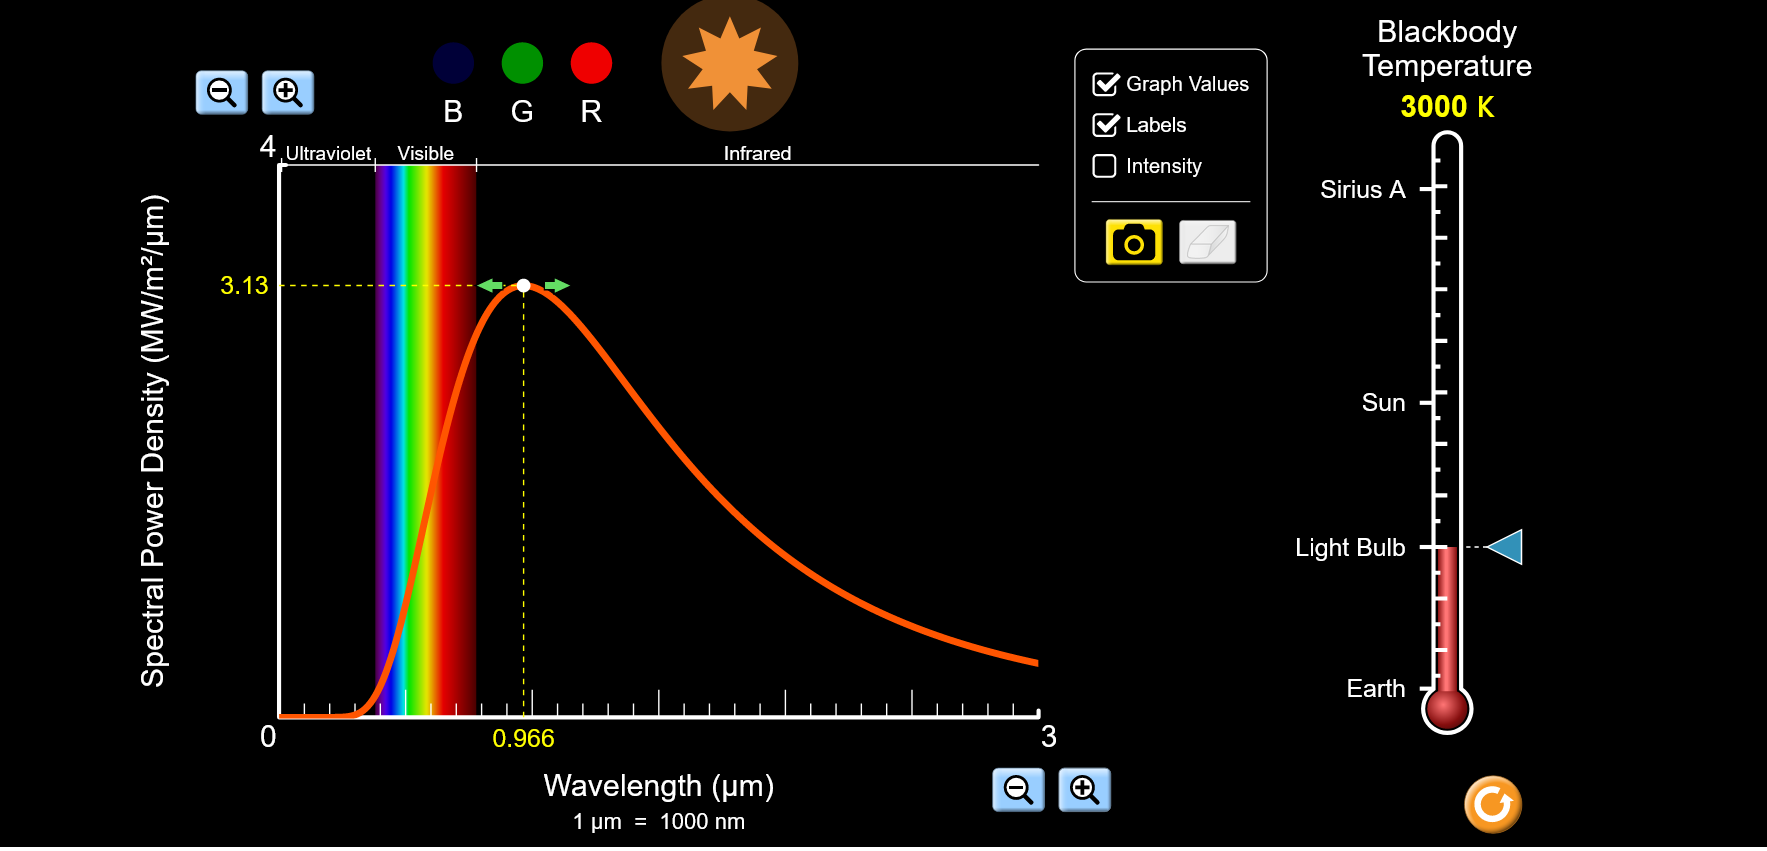
Using the diagram above, answer these questions:
- Describe the shape of the graph. Is it symmetrical?
- What types of light are emitted by this object?
- Find the peak wavelength and see where that wavelength falls on the
spectrum. (This is the wavelength that will be labeled by default on the x-axis.)
Wavelength _______________________ Type of light _____________________
Also please explain how you got the wavelength and what type of light it is.