Home /
Expert Answers /
Physics /
thermodynamic-processes-and-pv-diagrams-the-pv-diagram-below-shows-the-graphs-for-four-different-th-pa306
(Solved): Thermodynamic Processes and pV Diagrams The pV diagram below shows the graphs for four different th ...

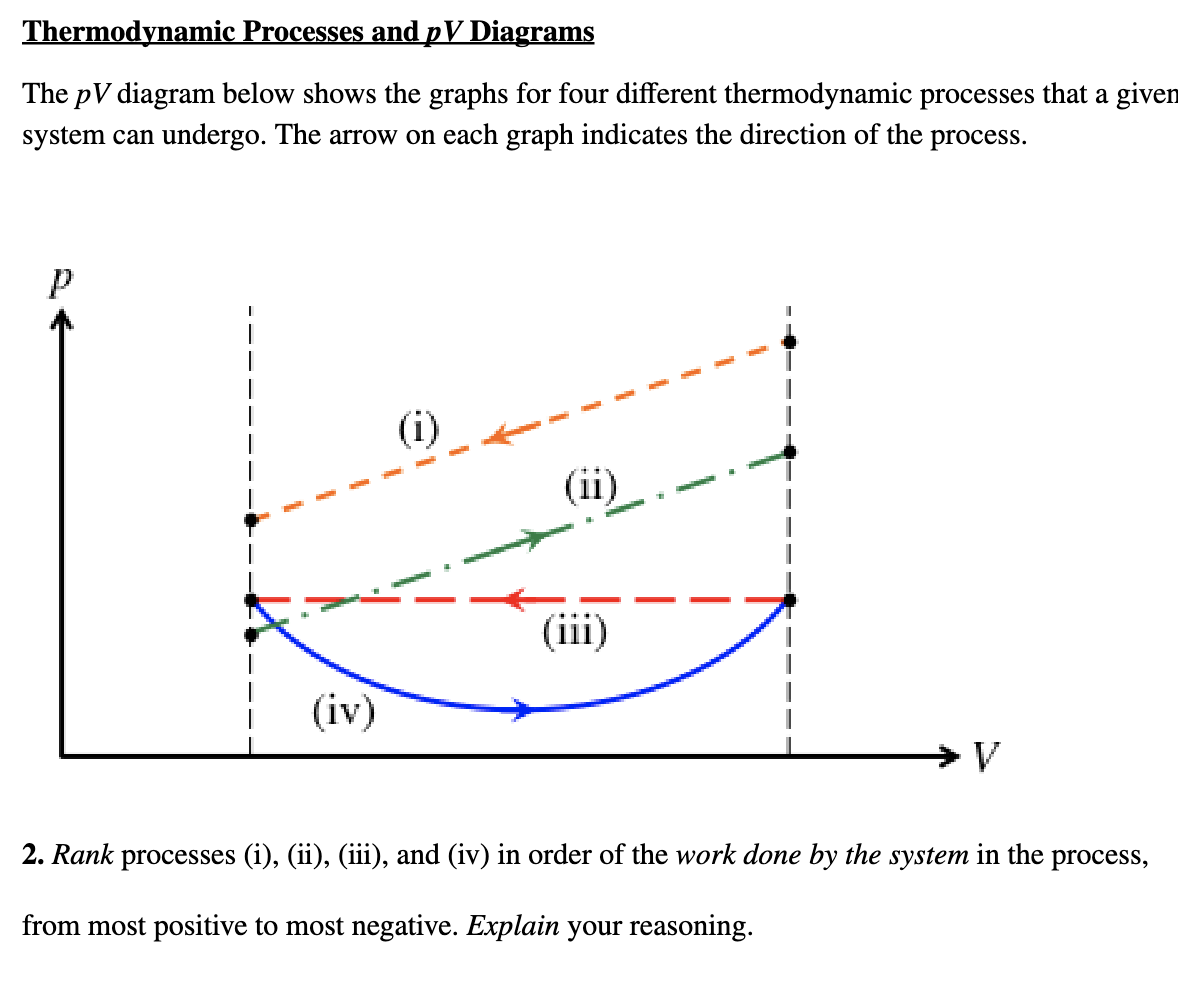
Thermodynamic Processes and Diagrams The diagram below shows the graphs for four different thermodynamic processes that a giver system can undergo. The arrow on each graph indicates the direction of the process. 2. Rank processes (i), (ii), (iii), and (iv) in order of the work done by the system in the process, from most positive to most negative. Explain your reasoning.
Expert Answer
Work done by a system is said to be positive when its volume get expand, whereas it is said to be ne...