Home /
Expert Answers /
Earth Sciences /
theissen-rainfall-estimation-the-green-region-below-shows-the-map-of-a-catchm-pa976
(Solved): Theissen rainfall estimation The green region below shows the map of a catchm ...
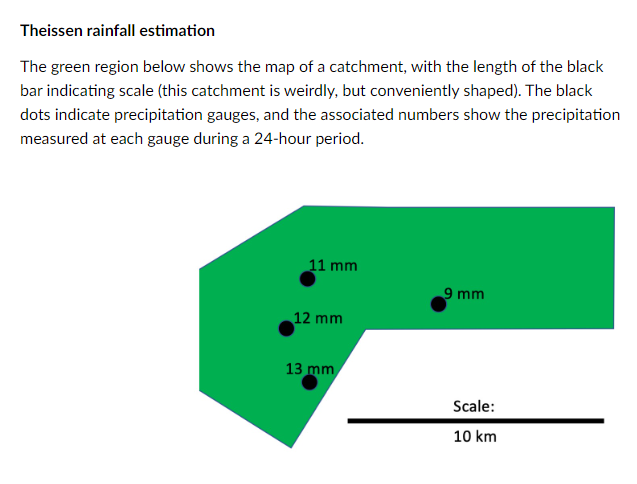
Theissen rainfall estimation The green region below shows the map of a catchment, with the length of the black bar indicating scale (this catchment is weirdly, but conveniently shaped). The black dots indicate precipitation gauges, and the associated numbers show the precipitation measured at each gauge during a 24-hour period.
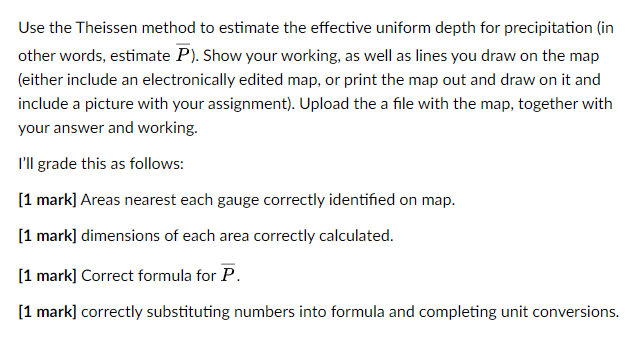
Use the Theissen method to estimate the effective uniform depth for precipitation (in other words, estimate \( \bar{P} \) ). Show your working, as well as lines you draw on the map (either include an electronically edited map, or print the map out and draw on it and include a picture with your assignment). Upload the a file with the map, together with your answer and working. I'll grade this as follows: [1 mark] Areas nearest each gauge correctly identified on map. [1 mark] dimensions of each area correctly calculated. [1 mark] Correct formula for \( \bar{P} \). [1 mark] correctly substituting numbers into formula and completing unit conversions.
Expert Answer
FIRSTLY IF YOU HAVE ANY QUERIES PLEASE ASK IN COMMENTS SECTION AND THANKS YOU.... . THE ANSWER OF THE