(Solved): The voltage pulse shown in (Figure 1) is applied to the ideal integrating amplifier shown in (Figure ...
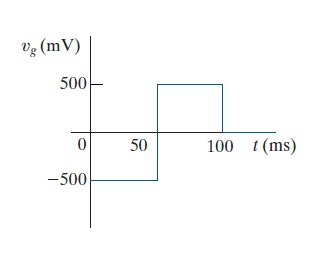
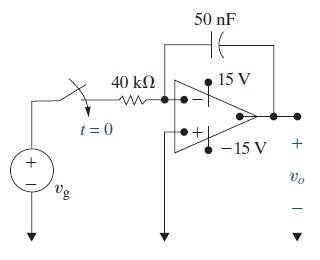
The voltage pulse shown in (Figure 1) is applied to the ideal integrating amplifier shown in (Figure 2). Take vo(0)=0.


PART A:
Derive the numerical expression for vo(t) for the time interval t<0.
Express your answer in terms of t, where t is in seconds, and the result is in volts.
PART B:
Derive the numerical expression for vo(t) for the time interval 0?t?50ms.
Express your answer in terms of t, where t is in seconds, and the result is in volts.
PART C:
Derive the numerical expression for vo(t) for the time interval 50ms?t?100ms.
Express your answer in terms of t, where t is in seconds, and the result is in volts.
PART D:
Derive the numerical expression for vo(t) for the time interval 100ms?t.
Express your answer in terms of t, where t is in seconds, and the result is in volts.