Home /
Expert Answers /
Statistics and Probability /
the-venn-diagrams-show-the-relationship-between-two-events-a-and-b-in-a-sample-space-s-the-shaded-pa765
(Solved): The Venn diagrams show the relationship between two events A and B in a sample space S. The shaded ...
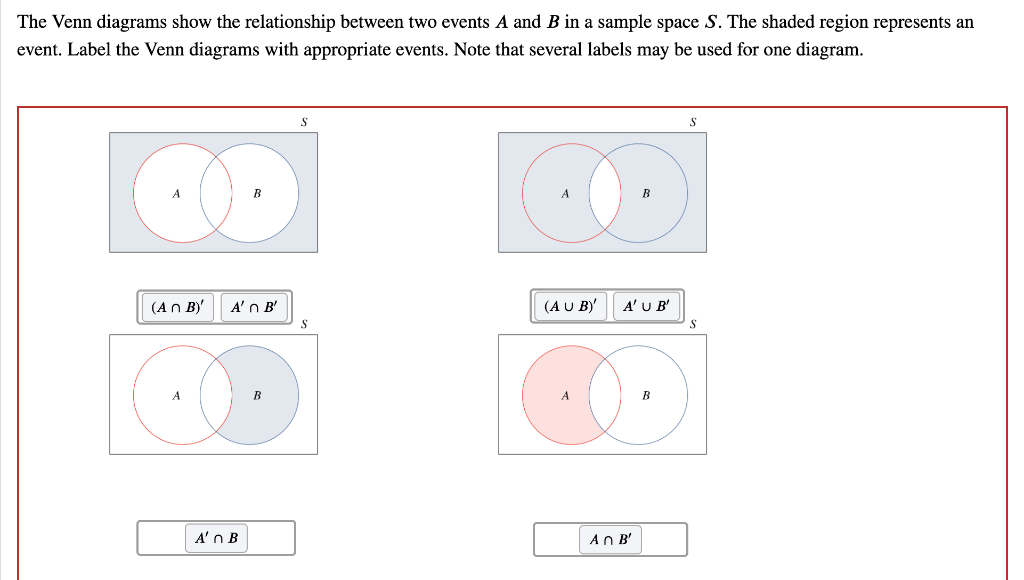
The Venn diagrams show the relationship between two events A and B in a sample space S. The shaded region represents an event. Label the Venn diagrams with appropriate events. Note that several labels may be used for one diagram. (An B)' A' B' A'n B (AUB) B A' U B' An B' B S