Home /
Expert Answers /
Statistics and Probability /
the-venn-diagram-below-shows-the-15-students-in-ms-bell-39-s-class-the-diagram-shows-the-membership-pa965
(Solved): The Venn diagram below shows the 15 students in Ms. Bell's class. The diagram shows the membership ...
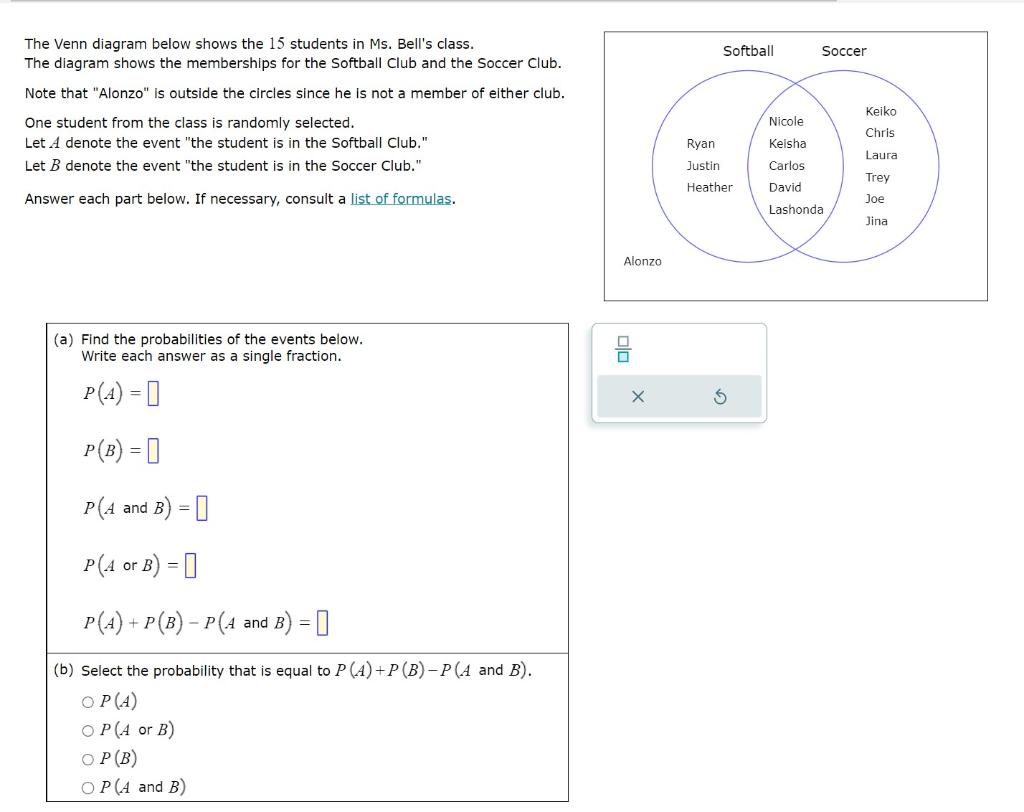
The Venn diagram below shows the 15 students in Ms. Bell's class. The diagram shows the memberships for the Softball Club and the Soccer Club. Note that "Alonzo" Is outside the circles since he is not a member of elther club. One student from the class is randomly selected. Let \( A \) denote the event "the student is in the Softball Club." Let \( B \) denote the event "the student is in the Soccer Club." Answer each part below. If necessary, consult a list of formulas. (a) Find the probabilities of the events below. Write each answer as a single fraction. \[ P(A)= \] \[ P(B)= \] \( P(A \) and \( B)= \) \( P(A \) or \( B)= \) \( P(A)+P(B)-P(A \) and \( B)= \) (b) Select the probability that is equal to \( P(A)+P(B)-P(A \) and \( B) \). \( P(A) \) \( P(A \) or \( B) \) \( P(B) \) \( P(A \) and \( B) \)