Home /
Expert Answers /
Accounting /
the-tree-diagram-in-figure-below-describes-the-uncertain-cash-flows-for-an-engineering-project-th-pa139
(Solved): The tree diagram in figure below describes the uncertain cash flows for an engineering project. Th ...
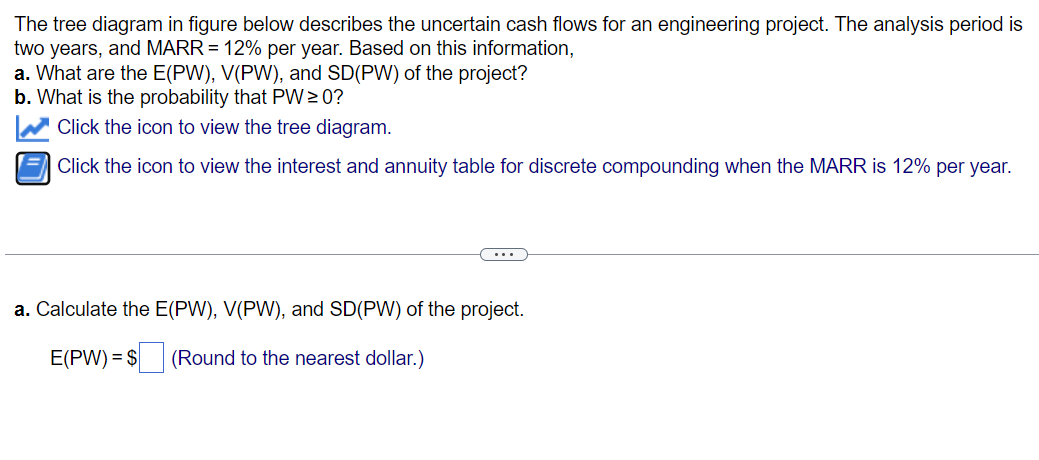
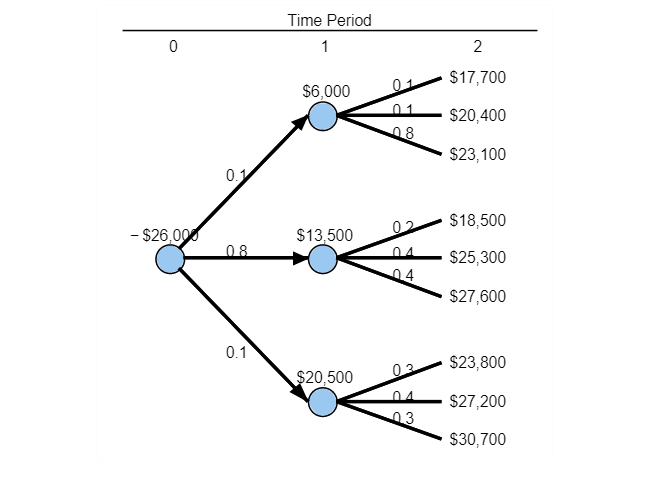
The tree diagram in figure below describes the uncertain cash flows for an engineering project. The analysis period is two years, and MARR per year. Based on this information, a. What are the , and of the project? b. What is the probability that ? Click the icon to view the tree diagram. Click the icon to view the interest and annuity table for discrete compounding when the MARR is per year. a. Calculate the , and of the project. (Round to the nearest dollar.
Time Period
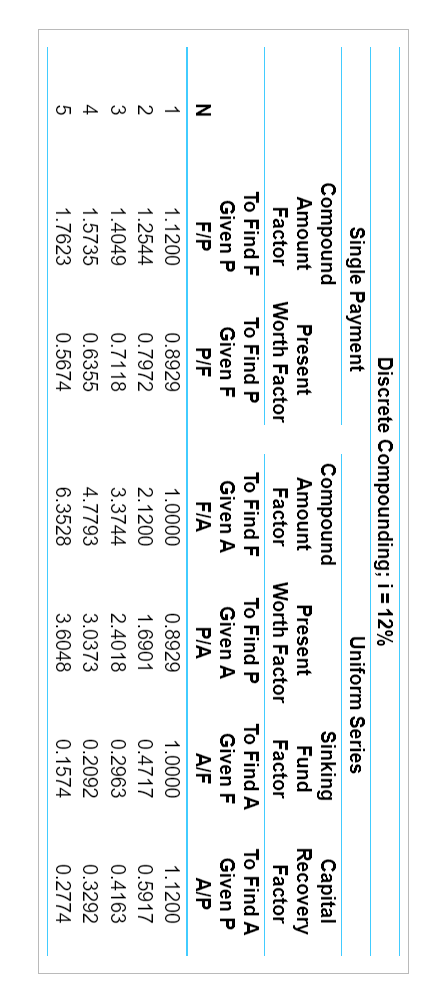
Discrete Compounding;
Expert Answer
Calculation of E(PW), V(PW), SD(PW).OutcomeProbability ( Pi )NPWE(PW)Pi ( NPW )10.1*0.1 = 0.01-6,532.53-65.3253426739.48220.1*0.1 = 0.01-4,380.10-43.8