Home /
Expert Answers /
Finance /
the-three-lines-in-the-graph-plot-the-npv-profiles-of-projects-a-b-and-c-in-the-data-table-above-pa413
(Solved): The three lines in the graph plot the NPV profiles of projects A, B and C in the data table, above ...
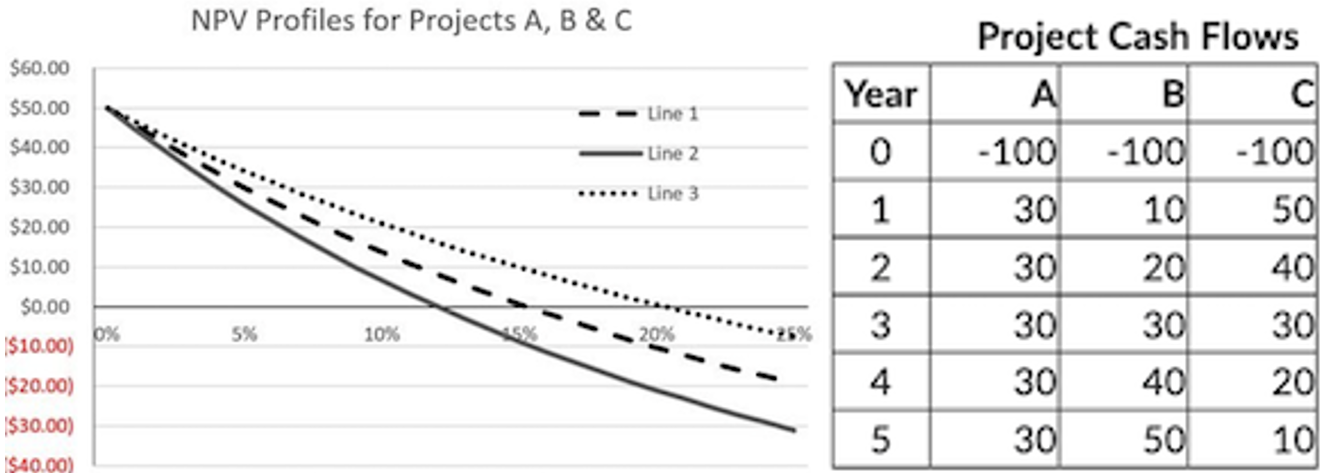
The three lines in the graph plot the NPV profiles of projects A, B and C in the data table, above. Line 2 is the NPV profile for Project
A? B? C?
PLEASE EXPLAIN WITH FULL SOLUTIONS AND EXPLANTIONS!!
NPV Profiles for Projects A, B \& C Proiect Cach Flnws
Expert Answer
The NPV profile can be identified by calculating the IRR of each p