Home /
Expert Answers /
Statistics and Probability /
the-table-below-shows-the-number-of-absences-and-the-final-grade-for-seven-7-students-in-the-bus-pa187
(Solved): The table below shows the number of absences and the final grade for seven (7) students in the Bus ...
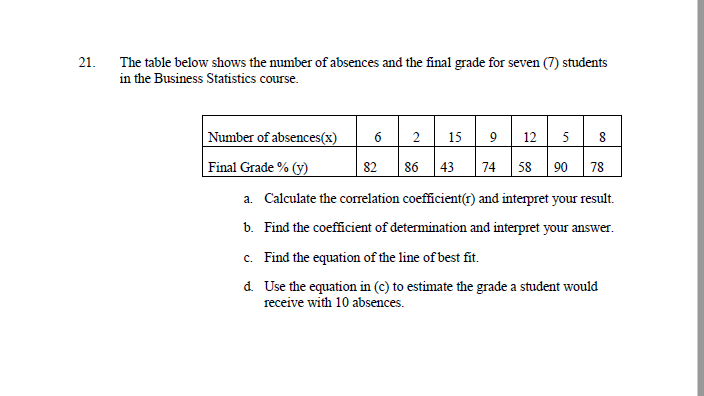
The table below shows the number of absences and the final grade for seven (7) students in the Business Statistics course. a. Calculate the correlation coefficient(r) and interpret your result. b. Find the coefficient of determination and interpret your answer. c. Find the equation of the line of best fit. d. Use the equation in (c) to estimate the grade a student would receive with 10 absences.
Expert Answer
The table of calculations: y x y-ybar x-xbar (y-ybar)^2 (x-xbar)^2 (x-xbar)*(y-ybar) 8