Home /
Expert Answers /
Statistics and Probability /
the-table-below-shows-data-on-a-subsample-of-n-10-participants-in-the-7-th-examination-of-the-pa404
(Solved): The table below shows data on a subsample of \( n=10 \) participants in the 7 th examination of the ...
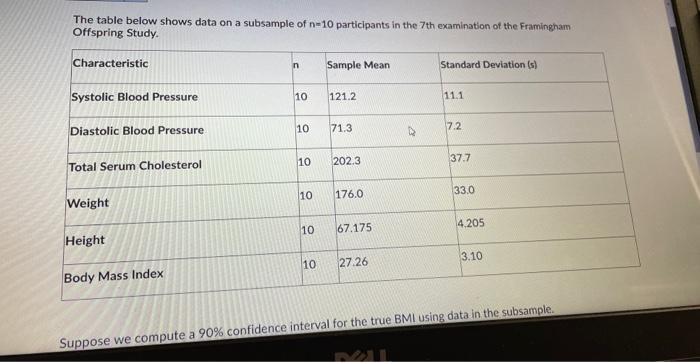
The table below shows data on a subsample of \( n=10 \) participants in the 7 th examination of the Framingham Offspring Study. Suppose we compute a \( 90 \% \) confidence interval for the true BMI using data in the subsample.
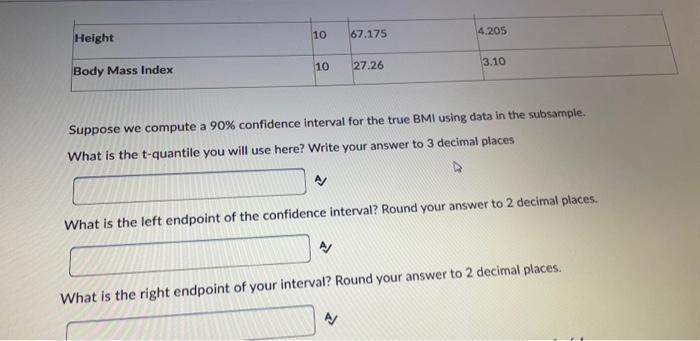
Suppose we compute a \( 90 \% \) confidence interval for the true BMI using data in the subsample. What is the t-quantile you will use here? Write your answer to 3 decimal places What is the left endpoint of the confidence interval? Round your answer to 2 decimal places. A) What is the right endpoint of your interval? Round your answer to 2 decimal places. A