Home /
Expert Answers /
Economics /
the-table-below-lists-the-prices-and-quantities-consumed-of-three-different-goods-from-2016-2018-pa616
(Solved): The table below lists the prices and quantities consumed of three different goods from \( 2016-2018 ...
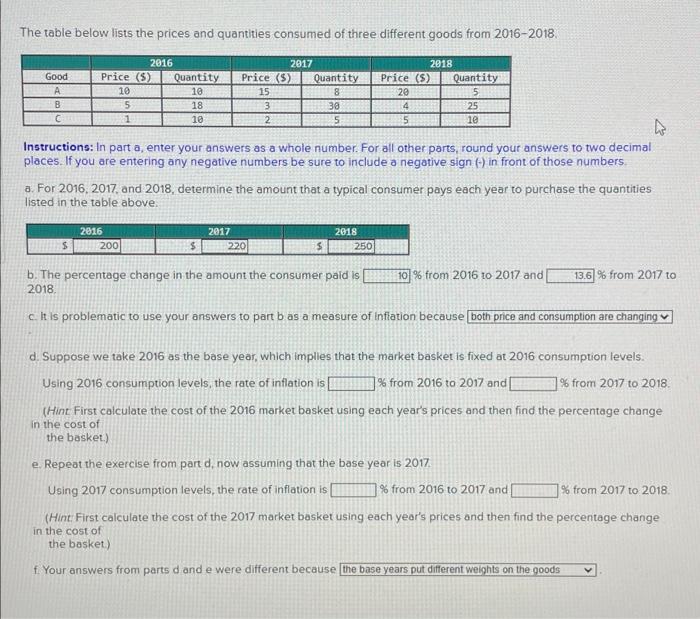
The table below lists the prices and quantities consumed of three different goods from \( 2016-2018 . \) Instructions: In part a, enter your answers as a whole number. For all other parts, round your answers to two decimal places. If you are entering any negative numbers be sure to include a negative sign \( (\mathcal{)} \) in front of those numbers. a. For 2016, 2017, and 2018, determine the amount that a typical consumer pays each year to purchase the quantities listed in the table above. b. The percentage change in the amount the consumer paid is \( \% \) from 2016 to 2017 and \% from 2017 to \( 2018 . \) c. It is problematic to use your answers to part b as a measure of infiation because d. Suppose we take 2016 as the base year, which implies that the market basket is fixed at 2016 consumption levels. Using 2016 consumption levels, the rate of inflation is \( \quad \% \) from 2016 to 2017 and 2017 to 2018 . (Hint First calculate the cost of the 2016 market basket using each year's prices and then find the percentage change in the cost of the basket.) e. Repeat the exercise from part d, now assuming that the base year is \( 2017 . \) Using 2017 consumption levels, the rate of inflation is \( \quad \% \) from 2016 to 2017 and 2017 to 2018 . (Hint: First calculate the cost of the 2017 market basket using each year's prices and then find the percentage change in the cost of the basket.) f. Your answers from parts \( d \) and e were different because
Expert Answer
Multiplying the price and quan