Home /
Expert Answers /
Civil Engineering /
the-table-below-displays-the-consolidation-test-results-of-a-clay-soil-sample-depicting-the-settle-pa709
(Solved): The table below displays the Consolidation test results of a clay soil sample, depicting the settle ...
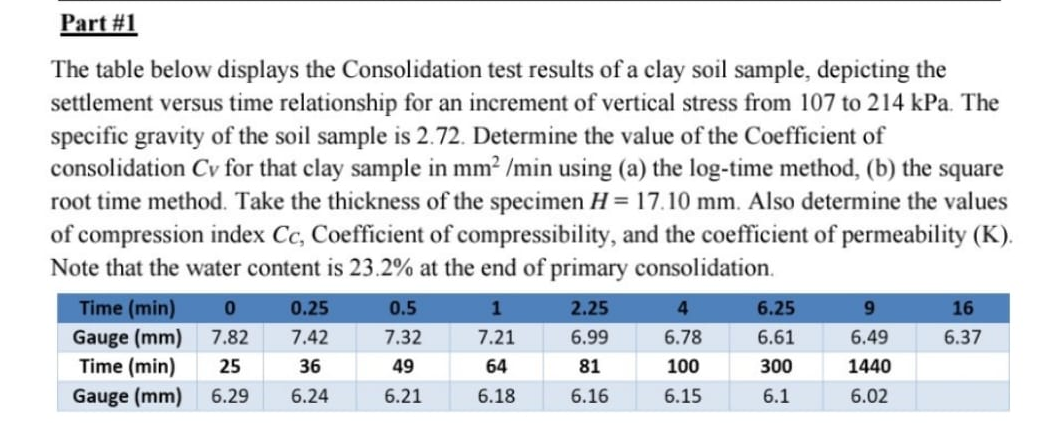
The table below displays the Consolidation test results of a clay soil sample, depicting the settlement versus time relationship for an increment of vertical stress from 107 to . The specific gravity of the soil sample is 2.72 . Determine the value of the Coefficient of consolidation for that clay sample in using (a) the log-time method, (b) the square root time method. Take the thickness of the specimen . Also determine the values of compression index , Coefficient of compressibility, and the coefficient of permeability (K). Note that the water content is at the end of primary consolidation.
Expert Answer
To determine the coefficient of consolidation (Cv) for the clay soil sample, we can use the following methods (a) Log-time Method: The settlement of the clay soil sample is given at different time intervals for an increment of vertical stress from 107 to 214 kPa. We can use the log-time method to determine the coefficient of consolidation (Cv) as follows: Using the above method, we get Cv = 0.056 mm²/min.