Home /
Expert Answers /
Physics /
the-speed-variation-trend-for-a-car-is-shown-in-the-following-figure-determine-a-the-total-dis-pa874
(Solved): The speed variation trend for a car is shown in the following figure: Determine: (a) The total dis ...
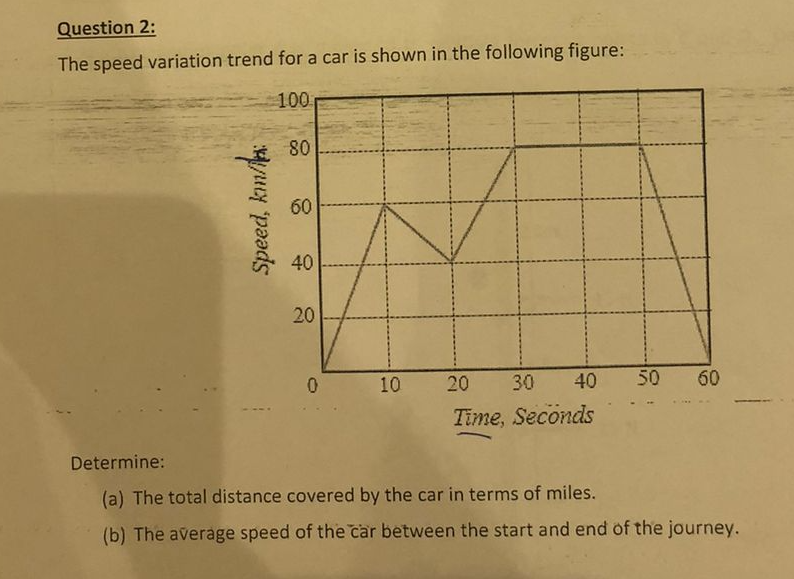
The speed variation trend for a car is shown in the following figure: Determine: (a) The total distance covered by the car in terms of miles. (b) The average speed of the car between the start and end of the journey.
Expert Answer
Part(a): We know that total distance covered by any particle is given by the total area under the Speed - time graph. Let us divide the graph in 5 sec
