Home /
Expert Answers /
Chemistry /
the-scatter-plot-shows-the-number-of-years-of-experience-x-and-the-amount-charged-per-hour-pa626
(Solved): The scatter plot shows the number of years of experience, \( x \), and the amount charged per hour, ...
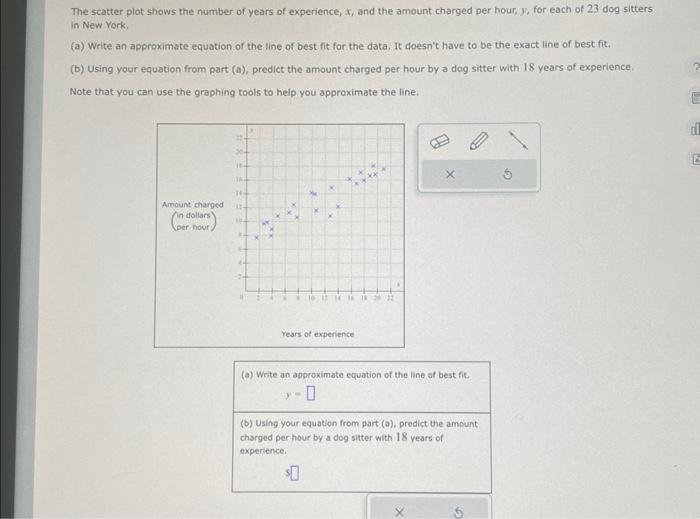
The scatter plot shows the number of years of experience, \( x \), and the amount charged per hour, \( y \), for each of 23 dog sitters in New York. (a) Write an approximate equation of the line of best fit for the data. It doesn't have to be the exact line of best fit, (b) Using your equation from part (a), predict the amount charged per hour by a dog sitter with 18 years of experience. Note that you can use the graphing tools to help you approximate the line. (a) Write an approximate equation of the line of best fic. (b) Using your equation from part (a), predict the amount charged per hour by a dog sitter with 18 years of experience.
Expert Answer
Step 1 From the given scatterplot, we can app