Home /
Expert Answers /
Computer Science /
the-scatter-plot-and-residual-plot-shown-below-are-based-on-a-regression-analysis-of-16-random-sol-pa910
(Solved): The scatter plot and residual plot shown below are based on a regression analysis of 16 random sol ...
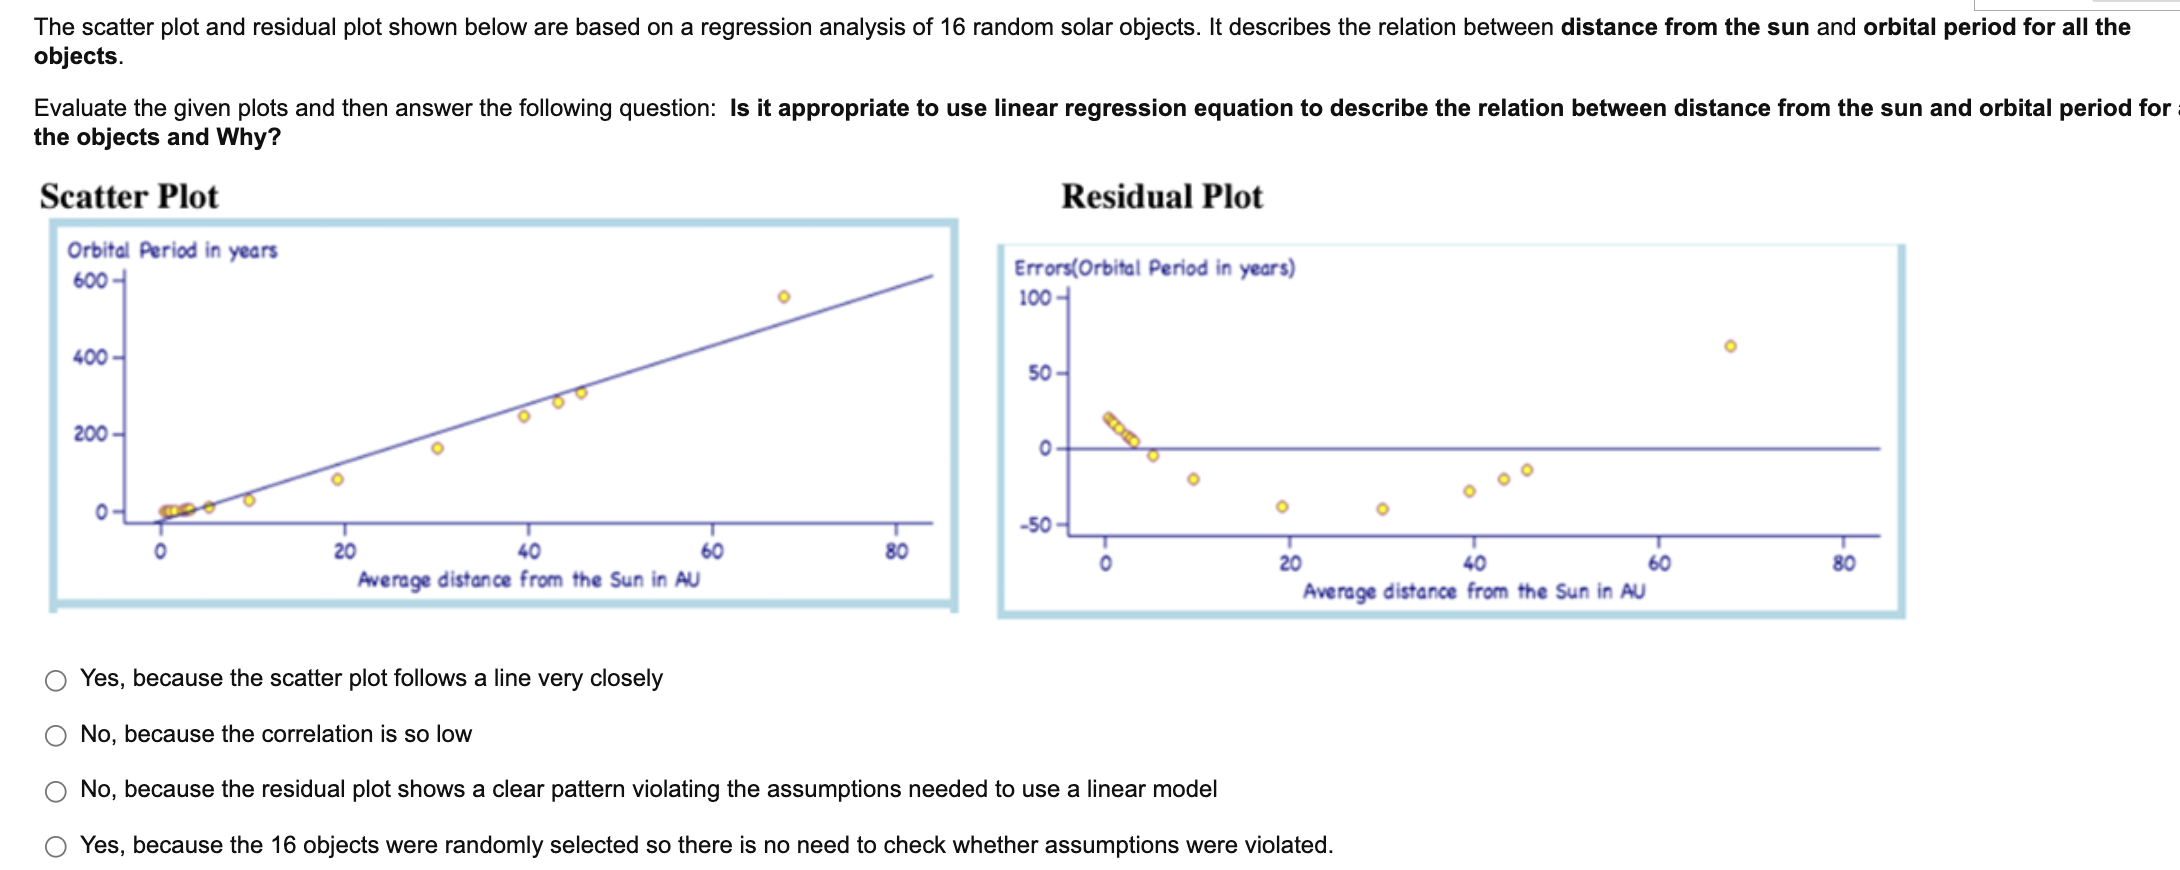
The scatter plot and residual plot shown below are based on a regression analysis of 16 random solar objects. It describes the relation between distance from the sun and orbital period for all the objects. Evaluate the given plots and then answer the following question: Is it appropriate to use linear regression equation to describe the relation between distance from the sun and orbital period for the objects and Why? Residual Plot Scatter Plot Orbital Period in years 600- Errors(Orbital Period in years) 100- 400 50- 200- o o ? -50 80 20 40 60 Average distance from the Sun in AU -O 80 20 40 60 Average distance from the Sun in AU Yes, because the scatter plot follows a line very closely No, because the correlation is so low O No, because the residual plot shows a clear pattern violating the assumptions needed to use a linear model Yes, because the 16 objects were randomly selected so there is no need to check whether assumptions were violated.
Expert Answer
Answer: No, because the residual plot
