Home /
Expert Answers /
Statistics and Probability /
the-scatter-chart-below-displays-the-residuals-versus-the-dependent-variable-t-which-of-th-pa522
(Solved): The scatter chart below displays the residuals versus the dependent variable, \( t \). Which of th ...
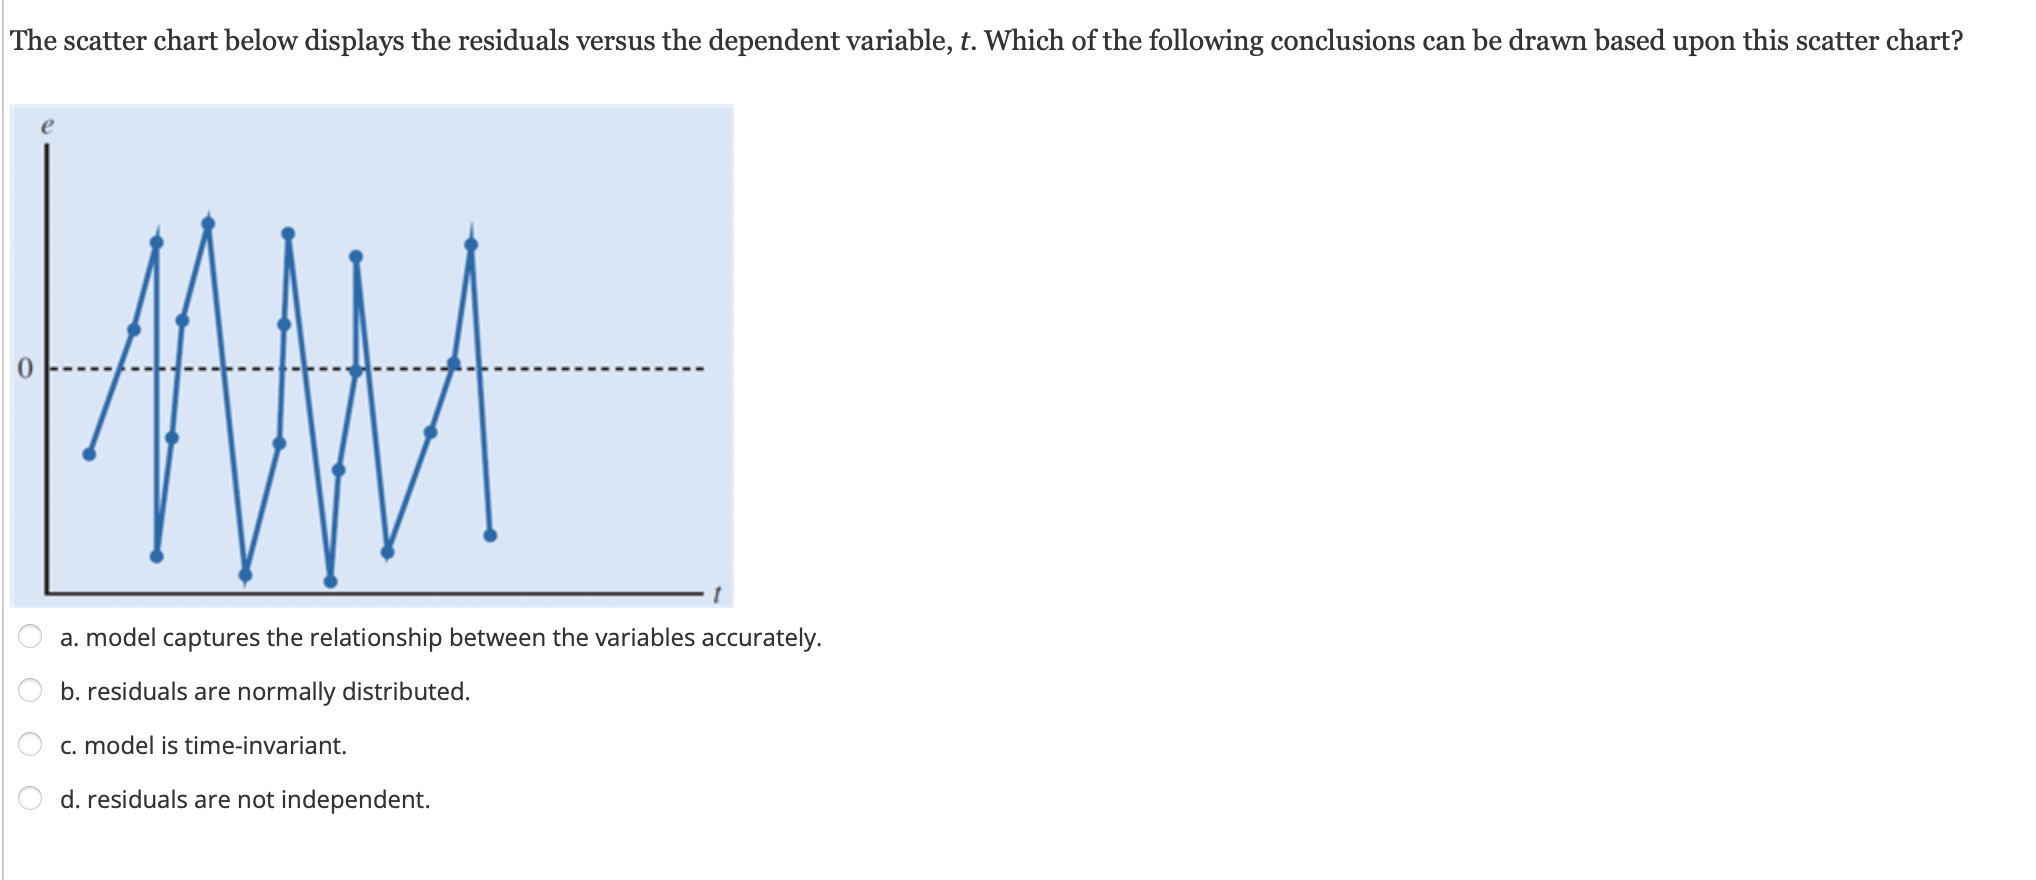
The scatter chart below displays the residuals versus the dependent variable, \( t \). Which of the following conclusions can be drawn based upon this scatter chart? a. model captures the relationship between the variables accurately. b. residuals are normally distributed. c. model is time-invariant. d. residuals are not independent.
Expert Answer
From the scatter plot ; by
