Home /
Expert Answers /
Electrical Engineering /
the-rectangular-pulse-shown-here-in-figure-a-is-applied-to-the-r-l-circuit-in-fig-pa231
(Solved): The rectangular pulse shown here in Figure \\( (a) \\) is applied to the \\( R L \\) circuit in Fig ...

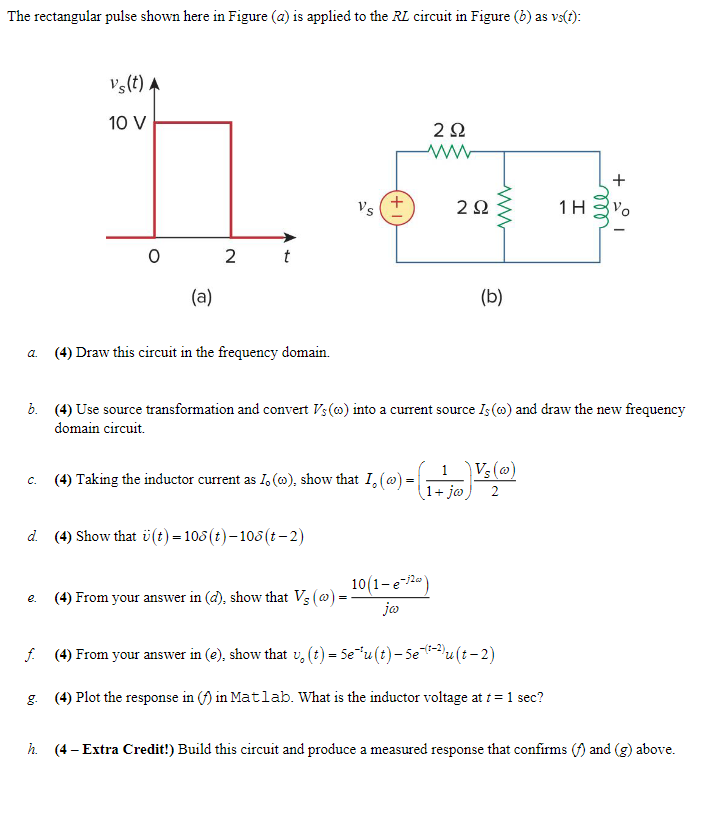
The rectangular pulse shown here in Figure \\( (a) \\) is applied to the \\( R L \\) circuit in Figure \\( (b) \\) as \\( v_{S}(t) \\) : (4) (b) a. (4) Draw this circuit in the frequency domain. b. (4) Use source transformation and convert \\( V_{S}(\\omega) \\) into a current source \\( I_{S}(\\omega) \\) and draw the new frequency domain circuit. c. (4) Taking the inductor current as \\( I_{0}(\\omega) \\), show that \\( I_{0}(\\omega)=\\left(\\frac{1}{1+j \\omega}\\right) \\frac{V_{S}(\\omega)}{2} \\) d. (4) Show that \\( \\ddot{v}(t)=10 \\delta(t)-10 \\delta(t-2) \\) e. (4) From your answer in \\( (d) \\), show that \\( V_{S}(\\omega)=\\frac{10\\left(1-e^{-j 2 \\omega}\\right)}{j \\omega} \\) f. (4) From your answer in (e), show that \\( v_{0}(t)=5 e^{-t} u(t)-5 e^{-(t-2)} u(t-2) \\) g. (4) Plot the response in \\( (f) \\) in Matlab. What is the inductor voltage at \\( t=1 \\mathrm{sec} \\) ? h. (4- Extra Credit!) Build this circuit and produce a measured response that confirms \\( (f) \\) and \\( (g) \\) above.
Expert Answer
Concept of Laplace and Inverse Laplace TransformWriting the given circuit in Laplace transform as