Home /
Expert Answers /
Physics /
the-position-versus-time-graph-for-a-simple-harmonic-oscillator-is-shown-in-figure-13-51-a-what-pa603
(Solved): The position versus time graph for a simple harmonic oscillator is shown in Figure 13-51. (a) What ...
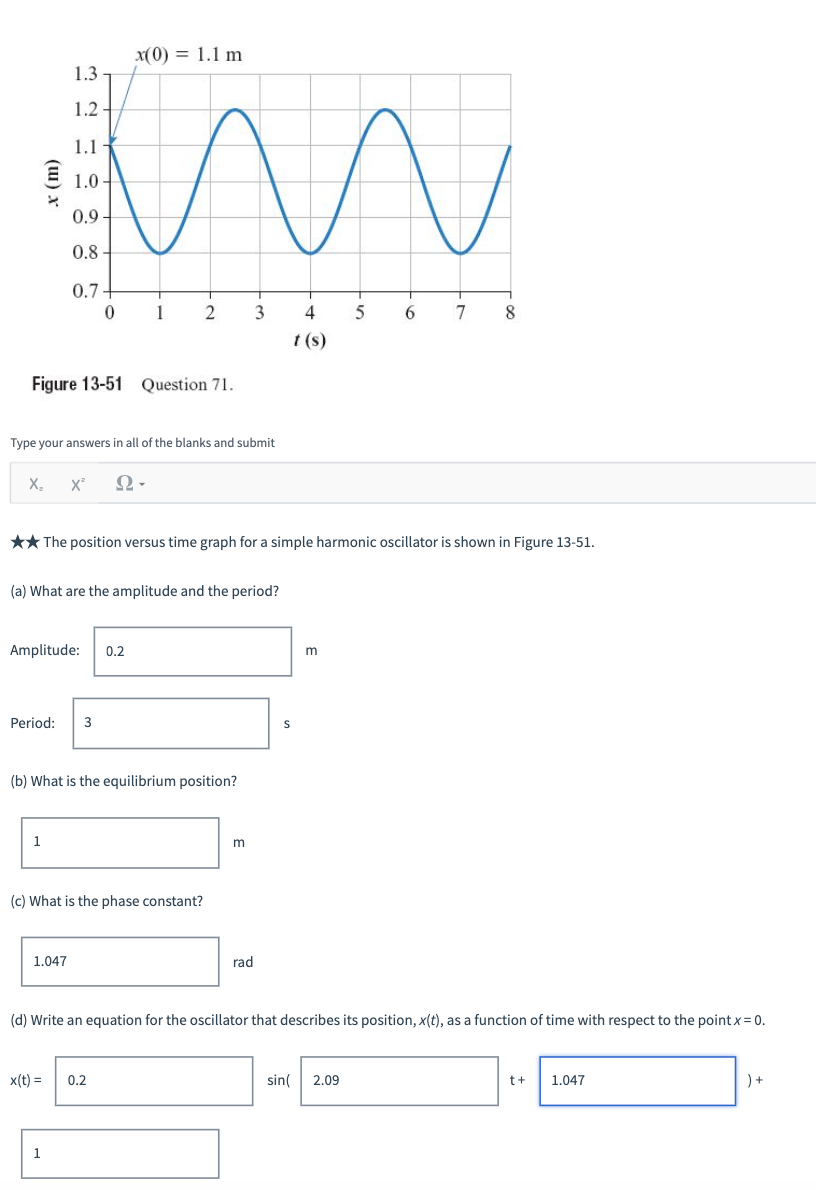
The position versus time graph for a simple harmonic oscillator
is shown in Figure 13-51.
(a) What are the amplitude and the period?
(b) What is the equilibrium position?
(c) What is the phase constant?
d) Write an equation for the oscillator that describes its position, x(t), as a function of time with respect to the point x = 0.
All my answers are correct. Please just show/explain in steps how they got pi/3 (1.047 rad) for the phase constant in part c) and part d)
Thanks!
Type your answers in all of the blanks and submit \( X_{2} \quad X^{2} \quad \Omega \) \( \star \star \) The position versus time graph for a simple harmonic oscillator is shown in Figure 13-51. (a) What are the amplitude and the period? Amplitude: \( \mathrm{m} \) Period: \( S \) (b) What is the equilibrium position? \( \mathrm{m} \) (c) What is the phase constant? rad (d) Write an equation for the oscillator that describes its position, \( x(t) \), as a function of time with respect to the point \( x=0 . \)
