Home /
Expert Answers /
Physics /
the-plot-shows-five-blackbody-curves-representing-the-brightness-of-a-star-vertical-axis-as-a-func-pa951
(Solved): The plot shows five blackbody curves representing the brightness of a star (vertical axis) as a func ...
The plot shows five blackbody curves representing the brightness of a star (vertical axis) as a function of wavelength in nanometers (horizontal axis).
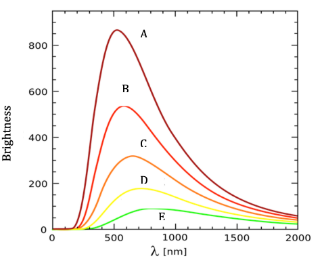
Which of the following shows the correct ranking of the temperature of the stars.
a) All the stars have the same temperature.
b) E > D > C > B > A
c) There is not enough information.
d) E > D > C = B = A
e) A > B > C > D > E
Expert Answer
Given plot is black body radiation spectrum for five different temperatures.