Home /
Expert Answers /
Statistics and Probability /
the-normal-quantile-plot-shown-to-the-right-represents-duration-times-in-seconds-of-eruptions-of-pa193
(Solved): The normal quantile plot shown to the right represents duration times (in seconds) of eruptions of ...
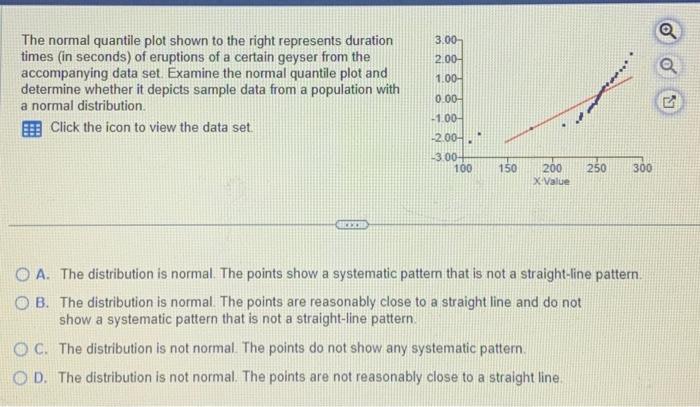
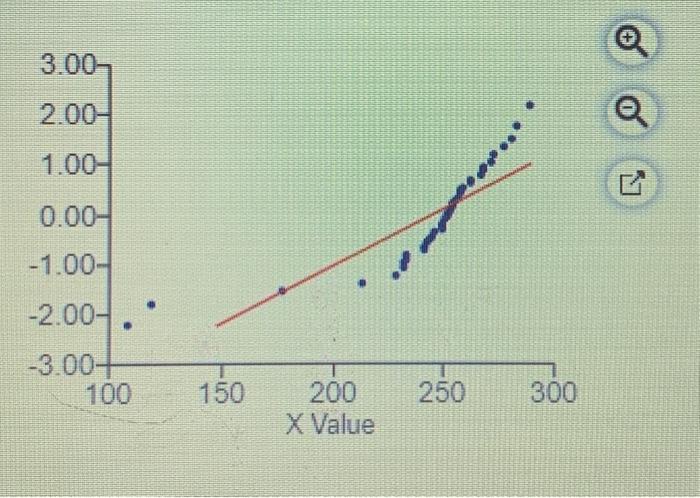
The normal quantile plot shown to the right represents duration times (in seconds) of eruptions of a certain geyser from the accompanying data set. Examine the normal quantile plot and determine whether it depicts sample data from a population with a normal distribution. Click the icon to view the data set. A. The distribution is normal. The points show a systematic pattern that is not a straight-line pattern. B. The distribution is normal. The points are reasonably close to a straight line and do not show a systematic pattern that is not a straight-line pattern. C. The distribution is not normal. The points do not show any systematic pattern. D. The distribution is not normal. The points are not reasonably close to a straight line.
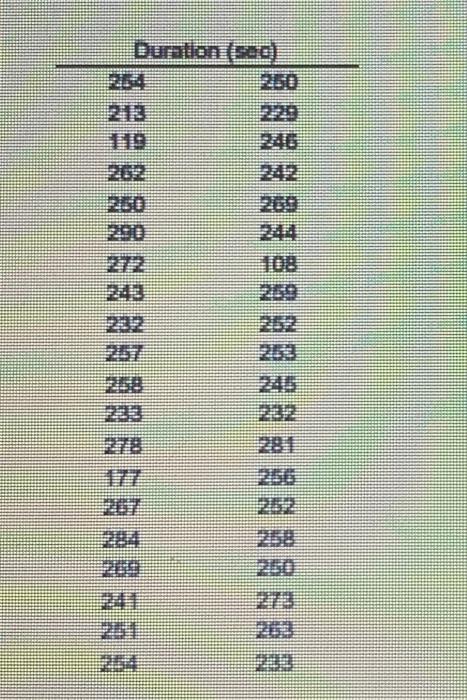
\begin{tabular}{|c|c|} \hline \multicolumn{2}{|c|}{ Duration(sec) } \\ \hline 264 & 250 \\ \hline 213 & 2229 \\ \hline 119 & 246 \\ \hline 202 & 242 \\ \hline 200 & 209 \\ \hline 290 & 244 \\ \hline 272 & 108 \\ \hline 243 & 259 \\ \hline 232 & 252 \\ \hline 257 & 203 \\ \hline 258 & 245 \\ \hline 233 & 232 \\ \hline 278 & 281 \\ \hline 177 & 250 \\ \hline 207 & 262 \\ \hline 284 & 258 \\ \hline 201 & 200 \\ \hline 241 & 273 \\ \hline 2il & 203 \\ \hline 214 & 233 \\ \hline \end{tabular}