Home /
Expert Answers /
Civil Engineering /
the-mass-curve-of-rainfall-in-a-storm-of-total-duration-90-minutes-is-given-below-time-minutes-0-pa734
(Solved): The mass curve of rainfall in a storm of total duration 90 minutes is given below. Time (minutes) 0 ...
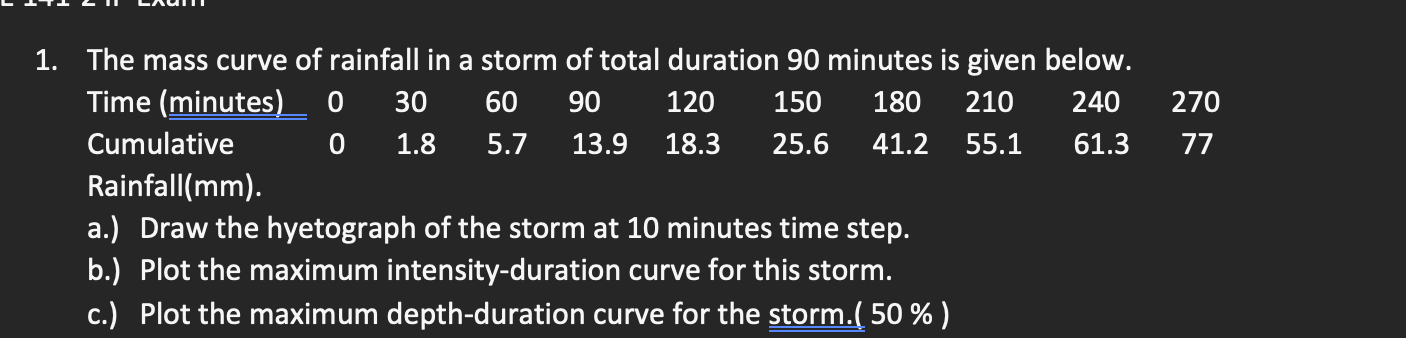
The mass curve of rainfall in a storm of total duration 90 minutes is given below.
Time (minutes) 0 30 60 90 120 150 180 210 240 270
Cumulative 0 1.8 5.7 13.9 18.3 25.6 41.2 55.1 61.3 77
Rainfall(mm).
a.) Draw the hyetograph of the storm at 10 minutes time step.
b.) Plot the maximum intensity-duration curve for this storm.
c.) Plot the maximum depth-duration curve for the storm
1. The mass curve of rainfall in a storm of total duration 90 minutes is given below. 0 30 90 Time (minutes) Cumulative 60 1.8 5.7 13.9 18.3 120 150 180 210 240 270 25.6 41.2 55.1 0 61.3 77 Rainfall (mm). a.) Draw the hyetograph of the storm at 10 minutes time step. b.) Plot the maximum intensity-duration curve for this storm. c.) Plot the maximum depth-duration curve for the storm.(50 %)