Home /
Expert Answers /
Earth Sciences /
the-maps-below-show-the-current-ph-values-of-surface-ocean-water-left-and-the-change-in-ph-values-pa471
(Solved): The maps below show the current pH values of surface ocean water (left) and the change in pH values ...
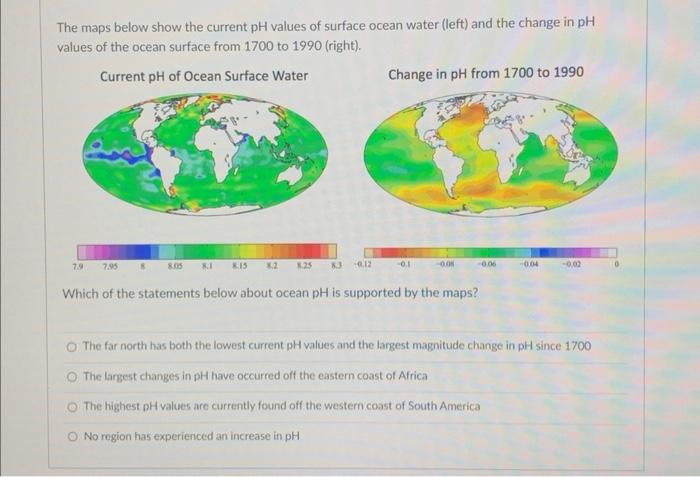
The maps below show the current values of surface ocean water (left) and the change in values of the ocean surface from 1700 to 1990 (right). Current pH of Ocean Surface Water Change in from 1700 to 1990 Which of the statements below about ocean is supported by the maps? The far north has both the lowest current pH values and the largest magnitude change in since 1700 The largest changes in have occurred off the eastern coast of Africa The highest pH values are currently found off the western coast of South America No region has experienced an increase in
Expert Answer
Correct answer:-Option-AA