Home /
Expert Answers /
Algebra /
the-line-graph-shows-the-cost-of-inflation-in-some-country-what-cost-100-in-1999-would-cost-the-a-pa846
(Solved): The line graph shows the cost of inflation in some country. What cost $100 in 1999 would cost the a ...
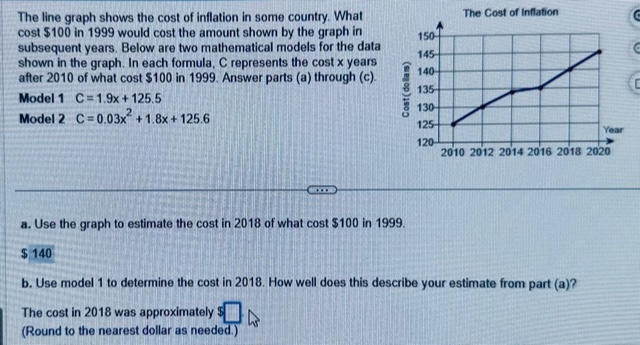
The line graph shows the cost of inflation in some country. What cost in 1999 would cost the amount shown by the graph in subsequent years. Below are two mathematical models for the data shown in the graph. In each formula, C represents the cost years after 2010 of what cost in 1999 . Answer parts (a) through (c). Model Model a. Use the graph to estimate the cost in 2018 of what cost in 1999. b. Use model 1 to determine the cost in 2018. How well does this describe your estimate from part (a)? The cost in 2018 was approximately (Round to the nearest dollar as needed.)
Expert Answer
Here , in this question we are given a graph of inflation of a country with years We are also give...