Home /
Expert Answers /
Earth Sciences /
the-herzsprung-russell-diagram-the-first-h-r-diagram-was-constructed-independ-pa174
(Solved): The Herzsprung-Russell Diagram The first H.R diagram was constructed independ ...
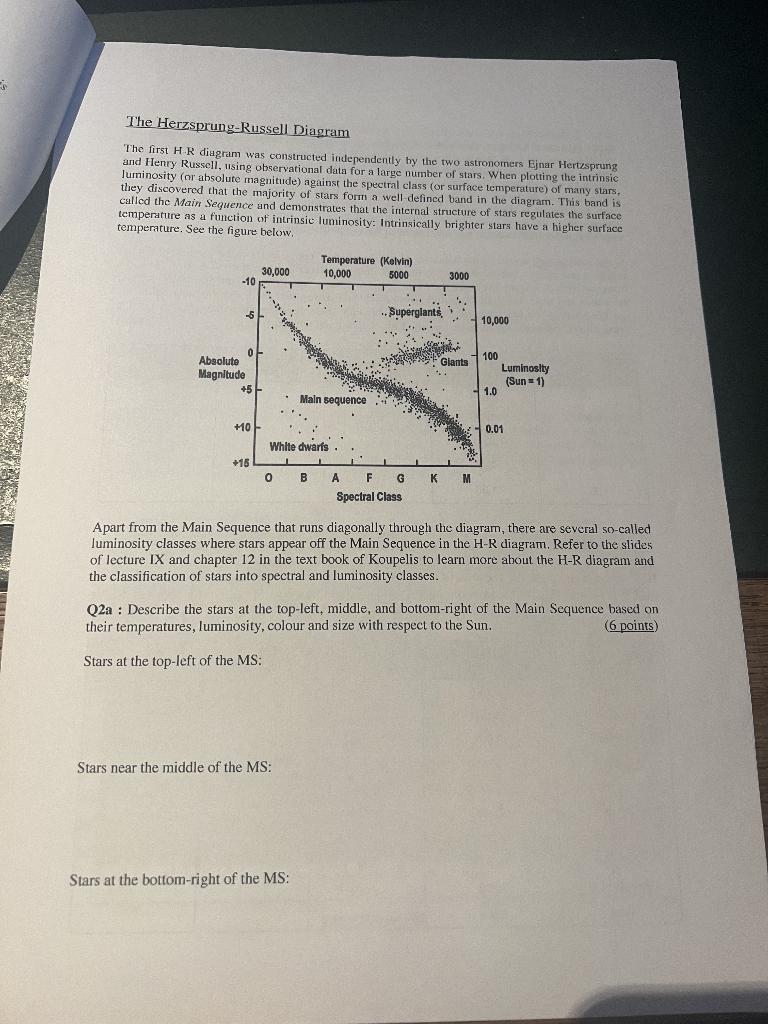
The Herzsprung-Russell Diagram The first H.R diagram was constructed independently by the two astronomers Ejnar Hertzsprung and Henry Russell, ,1sing observational data for a large number of stars. When plotting the intrinsie luminosity (ar absolute magnitude) against the spectral class (or surface temperature) of many stars, they discovered that the majority of stars form a well-definet band in the diagram. This band is called the Main Sequence and demonstrates that the internal structure of stars regulates the surface temperature as a function of intrinsic luminosity: Intrinsically brighter stars have a higher surface temperature. See the figure below. Apart from the Main Sequence that runs diagonally through the diagram, there are several so-called luminosity classes where stars appear off the Main Sequence in the H-R diagram. Refer to the slides of lecture IX and chapter 12 in the text book of Koupelis to learn more about the H-R diagram and the classification of stars into spectral and luminosity classes. Q2a : Describe the stars at the top-left, middle, and bottom-right of the Main Sequence based on their temperatures, Iuminosity, colour and size with respect to the Sun. (6points) Stars at the top-left of the MS: Stars near the middle of the MS: Stars at the bottom-right of the MS:
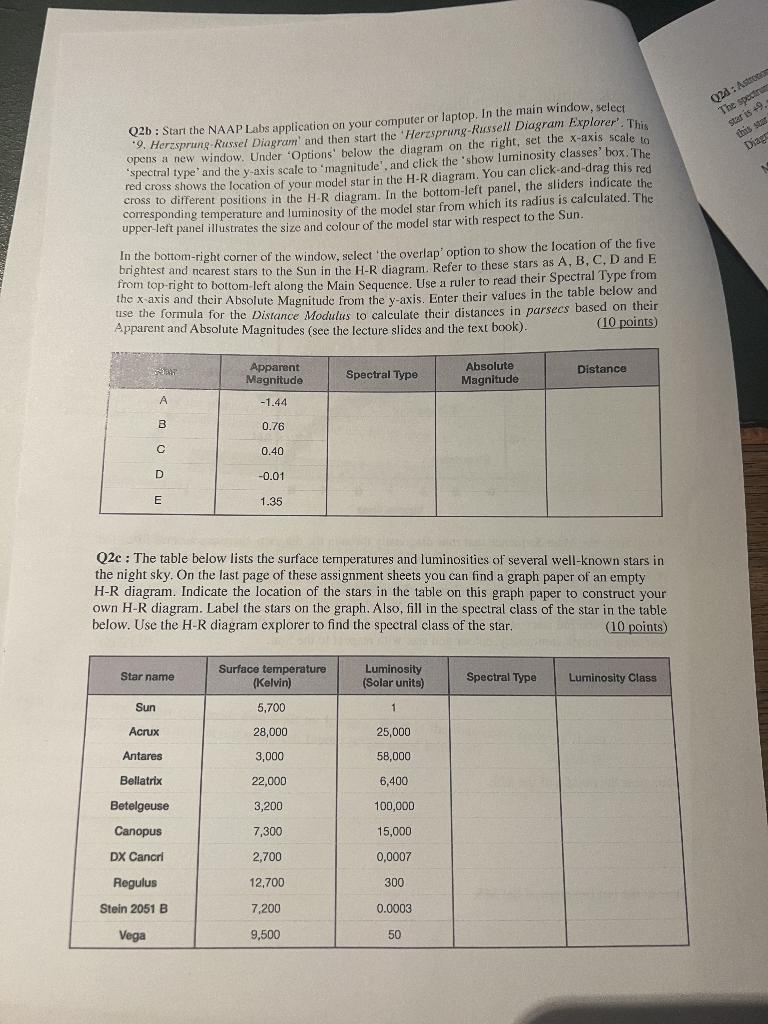
Q2b : Starl the NAAP Labs application on your computer or laptop. In the main window, select 99. Herzsprung-Russel Diagram' and then start the 'Herzprung-Russell Diagram Explorer'. This opens a new window. Under 'Options' below the diagram on the right, set the \( x \)-axis scale to 'spectral type' and the \( y \)-axis scale to 'magnitude', and click the 'show luminosity classes' box. The red cross shows tho location of your model star in the H-R diagram. You can click-and-drag this red cross to different positions in the H-R diagram. In the bottom-left panel, the sliders indicate the corresponding temperature and luminosity of the model star from which its radius is calculated. The upper-left panel illustrates the size and colour of the model star with respect to the Sun. In the bottom-right corner of the window, select 'the overlap' option to show the location of the five brightest and ncarest stars to the Sun in the H-R diagram. Refer to these stars as A, B, C, D and E from top-right to bottom-left along the Main Sequence. Use a ruler to read their Spectral Type from the \( \mathrm{x} \)-axis and their Absolute Magnitude from the \( y \)-axis. Enter their values in the table helow and use the formula for the Distance Modulus to calculate their distances in parsecs based on their Apparent and Absolute Magnitudes (see the lecture slides and the text book). (10 points) Q2c : The table below lists the surface temperatures and luminosities of several well-known stars in the night sky. On the last page of these assignment sheets you can find a graph paper of an empty \( \mathrm{H}-\mathrm{R} \) diagram. Indicate the location of the stars in the table on this graph paper to construct your own H-R diagram. Label the stars on the graph. Also, fill in the spectral class of the star in the table below. Use the H-R diagram explorer to find the spectral class of the star. (10 points)
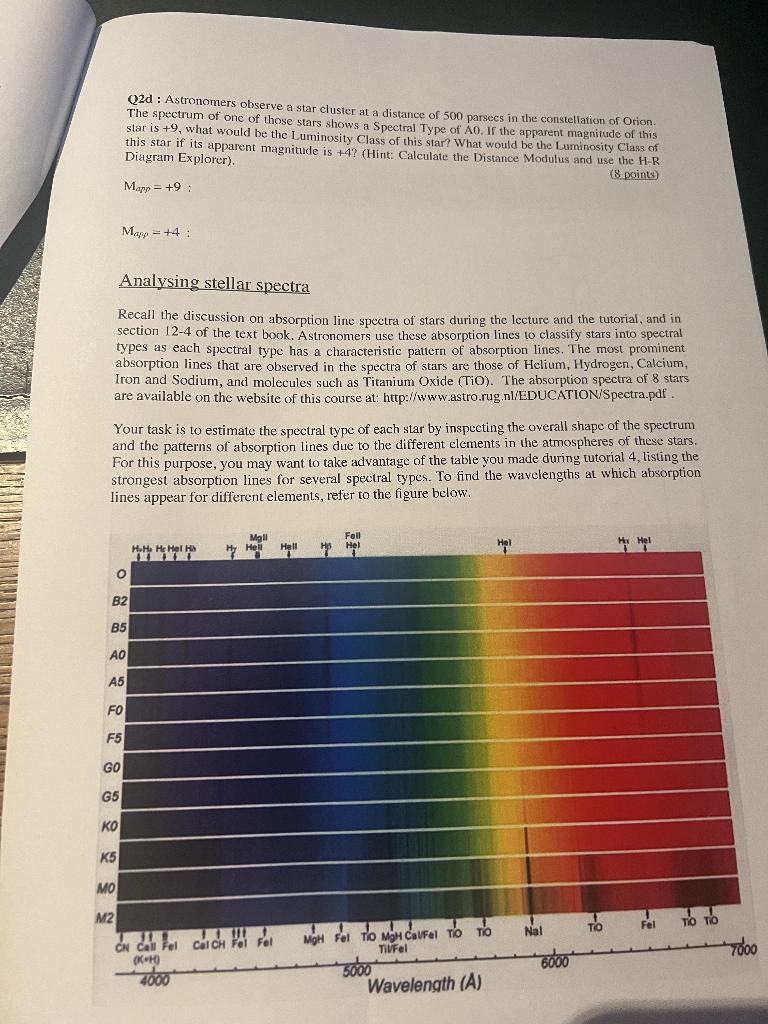
Q2d : Astronomers observe a star cluster at a distance of 500 parsecs in the constellation of Orion. The spectrum of one of those stars shows a Spectral Type of \( \mathrm{A} 0 \). If the apparent magnitude of this star is \( +9 \), what would be the Luminosity Class of this star? What would be the Luminosity Class of this star if its apparent magnitude is \( +4 \) ? (Hint: Calculate the Distance Modulus and use the H-R Diagram Explorer). (8 points) \[ \mathrm{M}_{a p p}=+9 \text { : } \] \[ \mathrm{M}_{a p p}=+4 \text { : } \] Analysing stellar spectra Recall the discussion on absorption line spectra of stars during the lecture and the tutorial, and in section 12-4 of the text book. Astronomers use these absorption lines to classify stars into spectral types as each spectral type has a characteristic pattern of absorption lines. The most prominent absorption lines that are observed in the spectra of stars are those of Helium, Hydrogen, Calcium, Iron and Sodium, and molecules such as Titanium Oxide (TiO). The absorption spectra of 8 stars are available on the website of this course at: http://www.astro.rug.nl/EDUCATION/Spectra.pdf . Your task is to estimate the spectral type of each star by inspecting the overall shape of the spectrum and the patterns of absorption lines due to the different elements in the atmospheres of these stars. For this purpose, you may want to take advantage of the table you made during tutorial 4 , listing the strongest absorption lines for several spectral types. To find the wavelengths at which absorption lines appear for different elements, refer to the figure below.
Expert Answer
2) a) The Hertzsprung-Russell diagrams(also called HR diagram ) is perhaps of the main apparatus in the investigation of heavenly development. Grown f