Home /
Expert Answers /
Other Math /
the-graphs-of-the-revenue-and-cost-functions-for-the-production-and-sale-of-x-units-are-show-pa287
(Solved): The graphs of the revenue and cost functions for the production and sale of \( x \) units are show ...
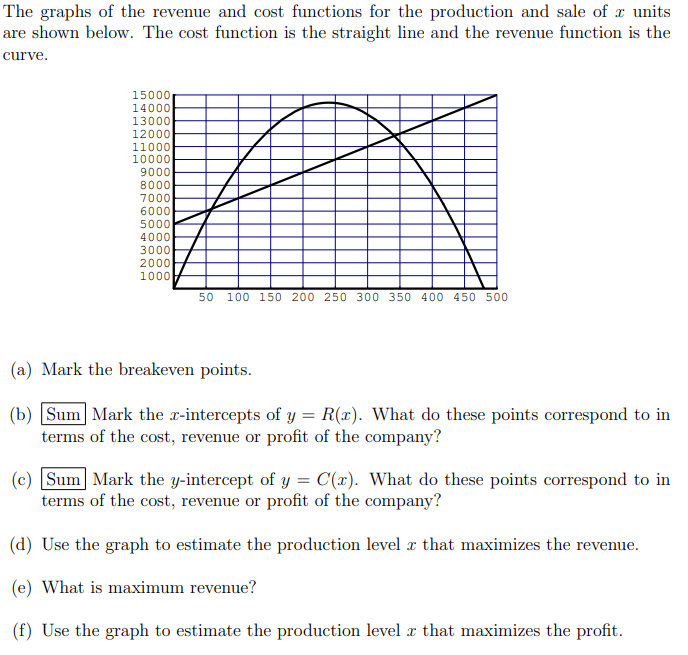
The graphs of the revenue and cost functions for the production and sale of \( x \) units are shown below. The cost function is the straight line and the revenue function is the curve. (a) Mark the breakeven points. (b) Mark the \( x \)-intercepts of \( y=R(x) \). What do these points correspond to in terms of the cost, revenue or profit of the company? (c) Mark the \( y \)-intercept of \( y=C(x) \). What do these points correspond to in terms of the cost, revenue or profit of the company? (d) Use the graph to estimate the production level \( x \) that maximizes the revenue. (e) What is maximum revenue? (f) Use the graph to estimate the production level \( x \) that maximizes the profit.
Expert Answer
Since, According to the question, The breakeven points in economics, business—and specifically cost accountin