Home /
Expert Answers /
Calculus /
the-graphs-below-show-level-sets-for-six-difierent-functions-where-the-red-areas-represent-the-the-pa584
(Solved): The graphs below show level sets for six difierent functions, where the red areas represent the the ...
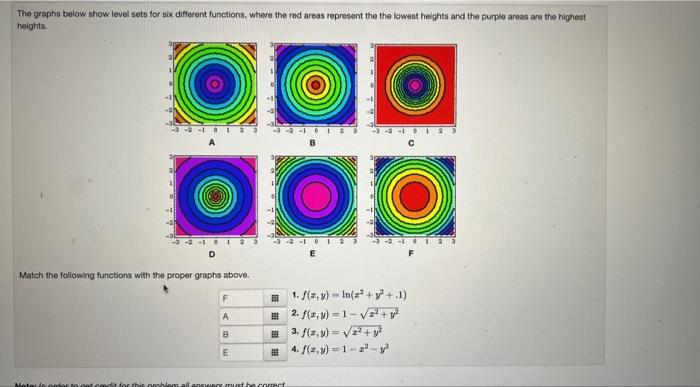
The graphs below show level sets for six difierent functions, where the red areas represent the the lowest heights and the purple areas are the highest hoights. A Match the following functions with the proper graphs above. 1. \( f(x, y)=\ln \left(z^{2}+y^{2}+1\right) \) 2. \( f(x, y)=1-\sqrt{x^{2}+y^{2}} \) 3. \( f(x, y)=\sqrt{x^{2}+y^{2}} \) 4. \( f(x, y)=1-x^{2}-y^{2} \)