Home /
Expert Answers /
Statistics and Probability /
the-graph-to-the-right-is-the-uniform-probability-density-function-for-a-friend-who-is-x-minutes-l-pa136
(Solved): The graph to the right is the uniform probability density function for a friend who is x minutes l ...
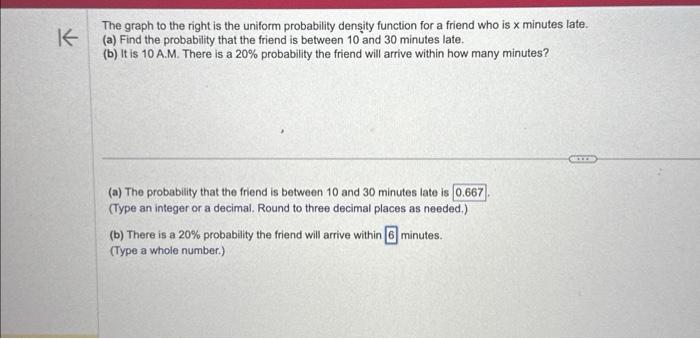
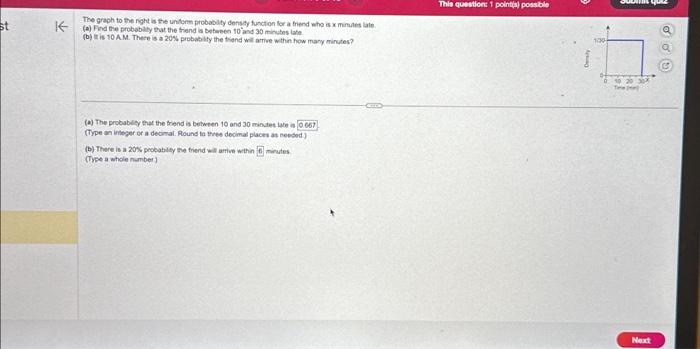
The graph to the right is the uniform probability density function for a friend who is minutes late. (a) Find the probability that the friend is between 10 and 30 minutes late. (b) It is 10 A.M. There is a probability the friend will arrive within how many minutes? (a) The probability that the friend is between 10 and 30 minutes late is (Type an integer or a decimal. Round to three decimal places as needed.) (b) There is a probability the friend will arrive within minutes. (Type a whole number.)
The graph to the inght is the unilonm probobity densyy function for a friend whe is minales late (a) Find the probabaly shat the triend is beteeen and 30 minutes lahe. (b) ir is . There is a probabily the thend will artive within how mary minules? (a) The probably that the triend is between 10 and 30 minites late is (Type on integer or a decomal. Round te tries decimal places at neesod) (b) There is a probabiley the friend wils artive within minutes (Type a whole number)
The graph to the right is the uniform probability density function for a friend who is minutes late. (a) Find the probability that the friend is between 10 and 30 minutes late. (b) It is 10 A.M. There is a probability the friend will arrive within how many minutes? (a) The probability that the friend is between 10 and 30 minutes late is (Type an integer or a decimal. Round to three decimal places as needed.) (b) There is a probability the friend will arrive within minutes. (Type a whole number.)