Home /
Expert Answers /
Precalculus /
the-graph-shows-the-depth-of-water-w-in-a-reservoir-over-a-one-year-period-as-a-function-of-pa697
(Solved): The graph shows the depth of water \( W \) in a reservoir over a one-year period as a function of ...
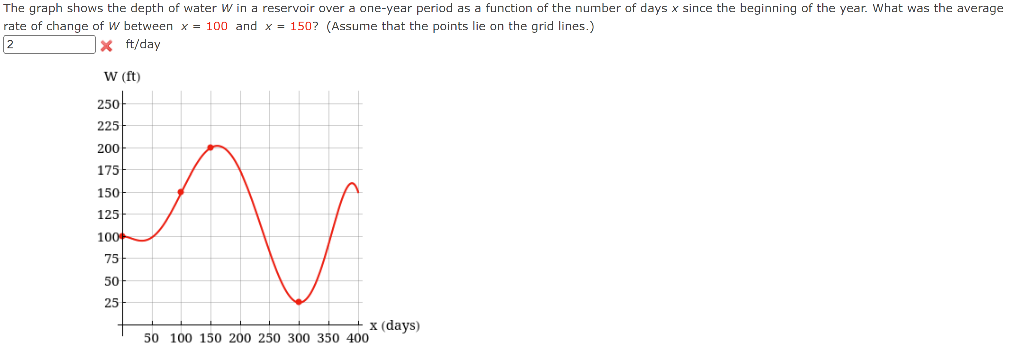
The graph shows the depth of water \( W \) in a reservoir over a one-year period as a function of the number of days \( x \) since the beginning of the year. What was the average ate of change of \( W \) between \( x=100 \) and \( x=150 \) ? (Assume that the points lie on the grid lines.) \& ft/day
