Home /
Expert Answers /
Physics /
the-graph-of-displacement-vs-time-for-a-small-mass-m-at-the-end-of-a-spring-is-shown-in-the-figure-pa748
(Solved): The graph of displacement vs. time for a small mass m at the end of a spring is shown in the figure ...
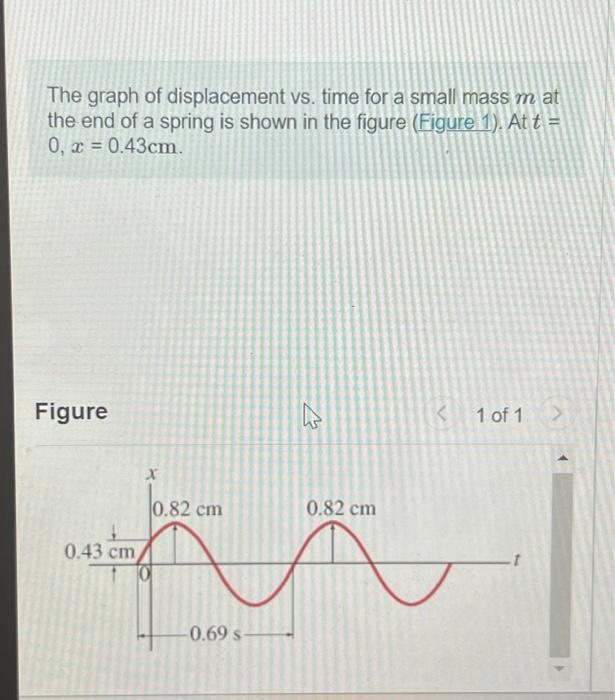
The graph of displacement vs. time for a small mass at the end of a spring is shown in the figure (Figure 1). At Figure 1 of 1
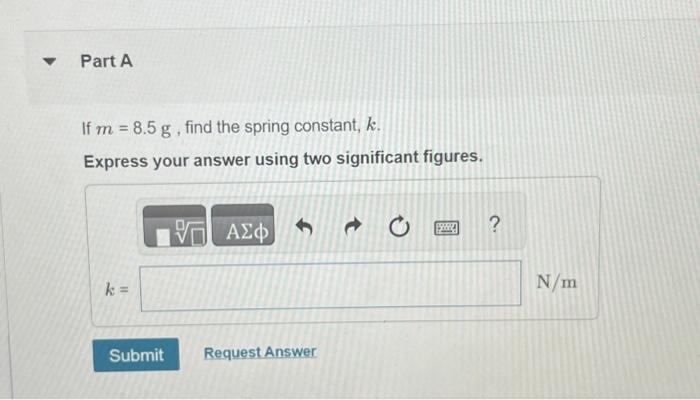
If , find the spring constant, . Express your answer using two significant figures.
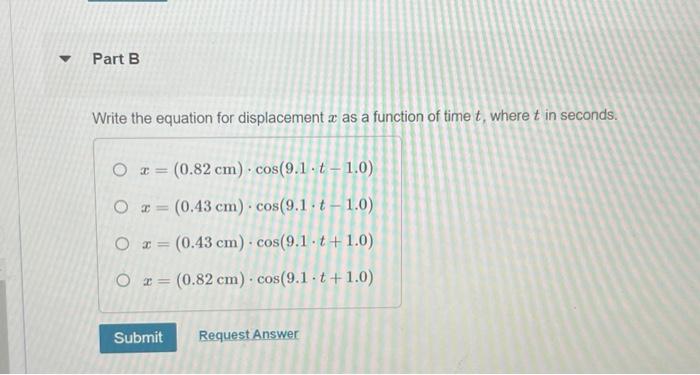
Write the equation for displacement as a function of time , where in seconds.
Expert Answer
A) The time period of the SHM can be determined from the graph given .The time after which the graph of position vs time of shm starts repeating itself is called the time period of the SHM.From the given graph, the time period of the SHM is 0.69s.In a simple harmonic motion, time period is given by where is the angular frequecy of the SHM . .