Home /
Expert Answers /
Economics /
the-graph-is-provided-only-to-help-you-visualize-u-shaped-curve-3-png-explain-why-the-short-run-n-pa484
(Solved): The graph is provided only to help you visualize U Shaped curve-3.png Explain why the short run (n ...
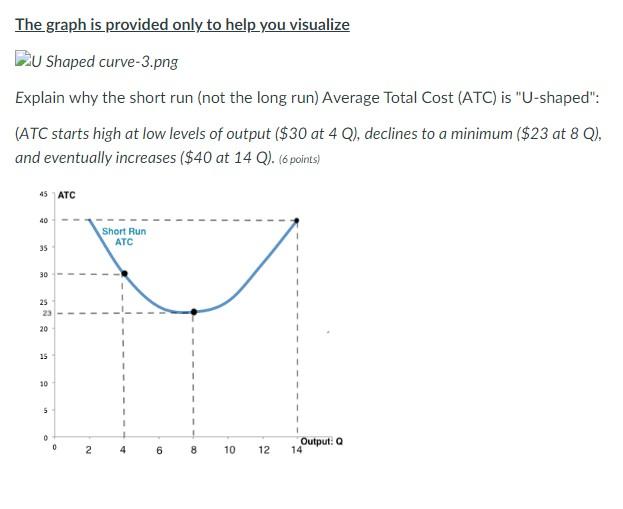
The graph is provided only to help you visualize U Shaped curve-3.png Explain why the short run (not the long run) Average Total Cost (ATC) is "U-shaped": (ATC starts high at low levels of output ($30 at 4 Q), declines to a minimum ($23 at 8 Q), and eventually increases ($40 at 14 Q). (6 points) 45 ATC 40 35 30 25 23 20 15 10 5 T 2 Short Run ATC 4 6 1 8 10 12 Output: Q 14
Expert Answer
The short run average total cost curve is a U shaped cost curve. It represent the law of variable proportion. Because as per the law of variable proportion in the first and third stages of the production a firm will not operate. because in the first