Home /
Expert Answers /
Statistics and Probability /
the-graph-in-figure-3-11-displays-the-sample-sizes-and-percentages-of-people-in-different-age-pa981
(Solved): The graph in Figure \( 3.11 \) displays the sample sizes and percentages of people in different age ...
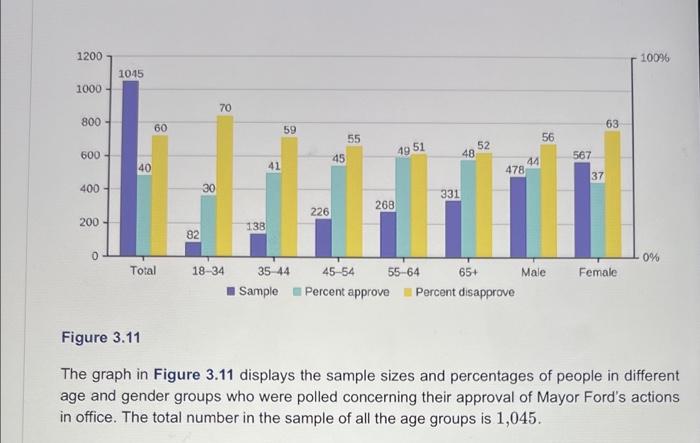
The graph in Figure \( 3.11 \) displays the sample sizes and percentages of people in different age and gender groups who were polled concerning their approval of Mayor Ford's actions in office. The total number in the sample of all the age groups is 1,045 .
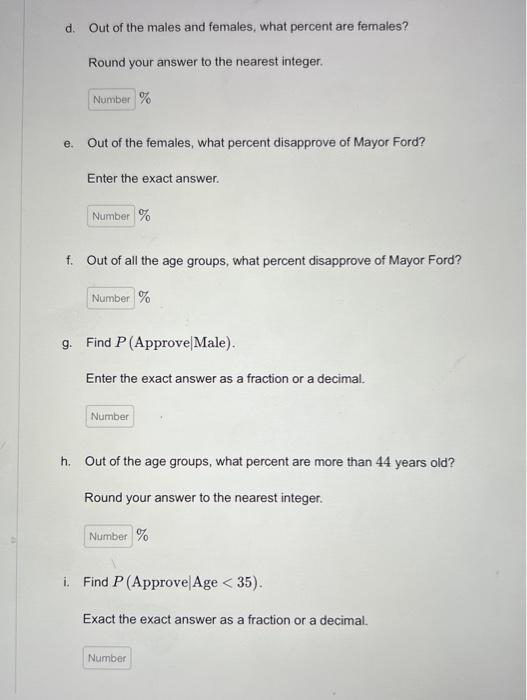
d. Out of the males and females, what percent are females? Round your answer to the nearest integer. e. Out of the females, what percent disapprove of Mayor Ford? Enter the exact answer. f. Out of all the age groups, what percent disapprove of Mayor Ford? g. Find \( P \) (Approve Male). Enter the exact answer as a fraction or a decimal. h. Out of the age groups, what percent are more than 44 years old? Round your answer to the nearest integer. \( \% \) i. Find \( P \) (Approve \( \mid \) Age \( <35) \). Exact the exact answer as a fraction or a decimal.
Expert Answer
From the given information: Sample size, N = 1045 (d) Per