Home /
Expert Answers /
Economics /
the-graph-below-shows-the-supply-and-demand-curves-for-mohair-a-wool-obtained-from-angora-goats-pa947
(Solved): The graph below shows the supply and demand curves for mohair, a wool obtained from angora goats. ...
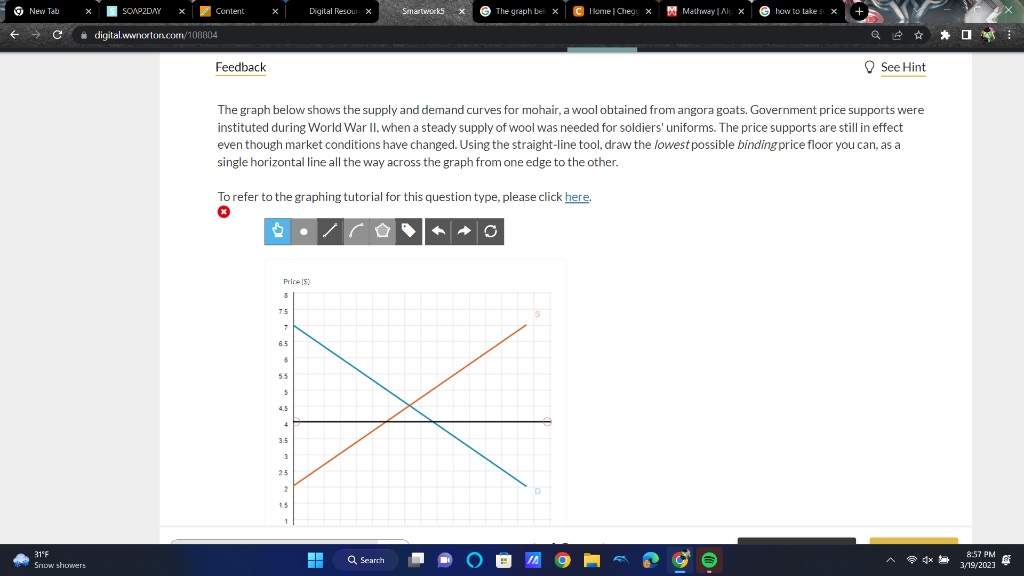
The graph below shows the supply and demand curves for mohair, a wool obtained from angora goats. Government price supports were instituted during World War II, when a steady supply of wool was needed for soldiers' uniforms. The price supports are still in effect even though market conditions have changed. Using the straight-line tool, draw the lowest possible binding price floor you can, as a single horizontal line all the way across the graph from one edge to the other. To refer to the graphing tutorial for this question type, please click here.
