Home /
Expert Answers /
Advanced Physics /
the-graph-below-shows-the-emf-produced-by-a-power-supply-as-a-function-of-time-note-when-the-pow-pa413
(Solved): The graph below shows the EMF produced by a power supply as a function of time. Note: When the pow ...
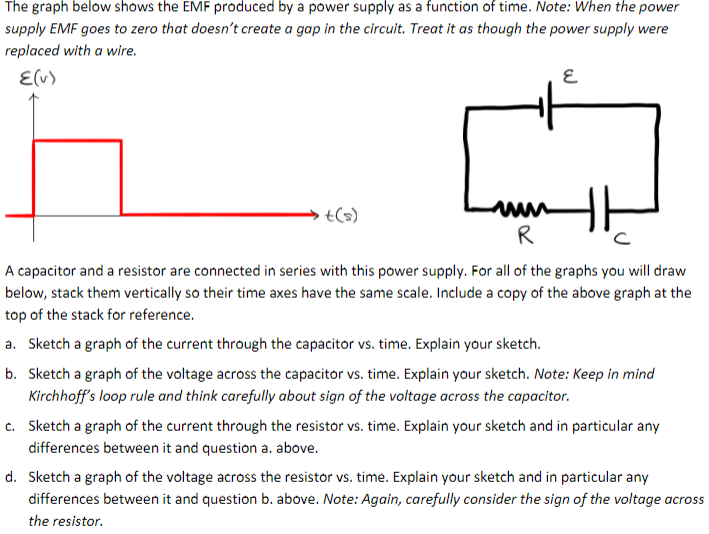
The graph below shows the EMF produced by a power supply as a function of time. Note: When the power supply EMF goes to zero that doesn't create a gap in the circuit. Treat it as though the power supply were replaced with a wire. {(v) t(s) ww R E A capacitor and a resistor are connected in series with this power supply. For all of the graphs you will draw below, stack them vertically so their time axes have the same scale. Include a copy of the above graph at the top of the stack for reference. a. Sketch a graph of the current through the capacitor vs. time. Explain your sketch. b. Sketch a graph of the voltage across the capacitor vs. time. Explain your sketch. Note: Keep in mind Kirchhoff's loop rule and think carefully about sign of the voltage across the capacitor. c. Sketch a graph of the current through the resistor vs. time. Explain your sketch and in particular any differences between it and question a. above. d. Sketch a graph of the voltage across the resistor vs. time. Explain your sketch and in particular any differences between it and question b. above. Note: Again, carefully consider the sign of the voltage across the resistor.
