Home /
Expert Answers /
Calculus /
the-graph-below-represents-the-rate-of-flow-of-water-in-and-out-of-a-tank-in-8-hours-out-of-the-ti-pa562
(Solved): The graph below represents the rate of flow of water in and out of a tank in 8 hours. Out of the ti ...
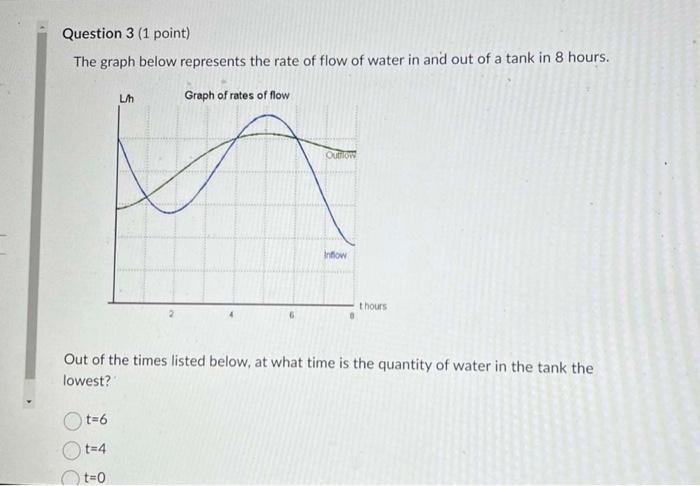
The graph below represents the rate of flow of water in and out of a tank in 8 hours. Out of the times listed below, at what time is the quantity of water in the tank the lowest? \[ \begin{array}{l} t=6 \\ t=4 \\ t=0 \end{array} \]
Expert Answer
Given that the graph represents the rate