Home /
Expert Answers /
Economics /
the-graph-below-depicts-an-economy-where-a-decline-in-aggregate-demand-has-caused-a-recession-assu-pa390
(Solved): The graph below depicts an economy where a decline in aggregate demand has caused a recession. Assu ...
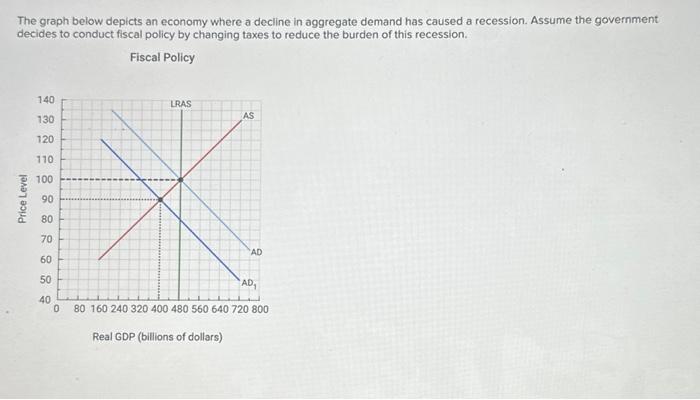
The graph below depicts an economy where a decline in aggregate demand has caused a recession. Assume the government decides to conduct fiscal policy by changing taxes to reduce the burden of this recession. Fiscal Policy
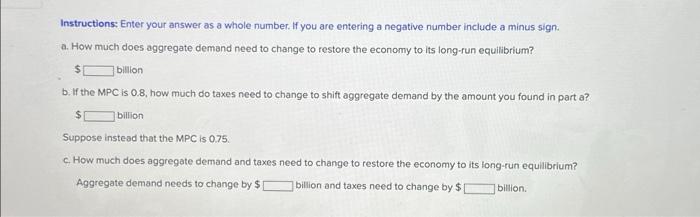
Instructions: Enter your answer as a whole number. If you are entering a negative number include a minus sign. a. How much does aggregate demand need to change to restore the economy to its long-run equilibrium? billion b. If the MPC is 0.8 , how much do taxes need to change to shift aggregate demand by the amount you found in part a? billion Suppose insteod that the MPC is 0.75 . c. How much does aggregate demand and taxes need to change to restore the economy to its long-run equilibrium? Aggregate demand needs to change by billion and taxes need to change by bilition.