Home /
Expert Answers /
Algebra /
the-given-bar-graph-shows-the-percentage-of-gross-domestic-product-gdp-in-a-state-going-toward-ho-pa298
(Solved): The given bar graph shows the percentage of gross domestic product (GDP) in a state going toward ho ...
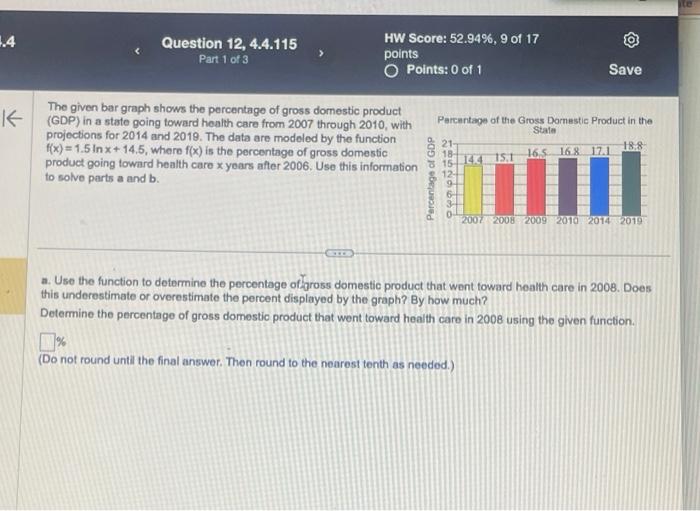
The given bar graph shows the percentage of gross domestic product (GDP) in a state going toward hoalth care from 2007 through 2010 , with projections for 2014 and 2019 . The data are modeled by the function \( f(x)=1.5 \ln x+14.5 \), where \( f(x) \) is the percentage of gross domestic product going toward health care \( x \) years after 2006 . Use this information to solve parts a and \( \mathbf{b} \). a. Use the function to determine the percentage of aross domestic product that went toward health care in 2008 . Does this underestimate or overestimate the percent displayed by the graph? By how much? Determine the percentage of gross domestic product that went toward health care in 2008 using the given function. \( \% \) (Do not round until the final answer. Then round to the nearest tenth as needed.)
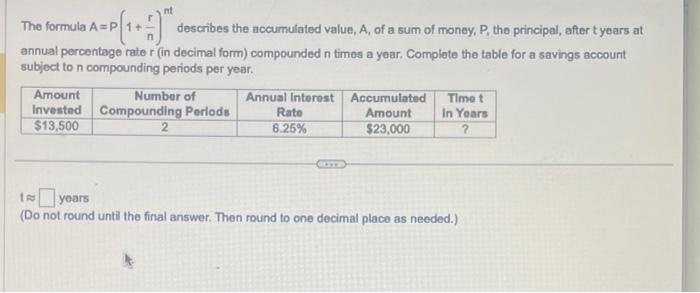
The formula \( A=P\left(1+\frac{r}{n}\right)^{n t} \) describes the accumulated value, \( A \), of a sum of money, \( P \), the principal, after \( t \) years at annual percentage rate \( r \) (in decimal form) compounded n times a year. Complete the table for a savings account subject to \( n \) compounding periods per year. \( t \approx \) yoars (Do not round unti the final answer. Then round to one decimal place as needed.)
Expert Answer
1)we have, f(x) = 1.5lnx + 14.5 Where, f(x) is th