Home /
Expert Answers /
Statistics and Probability /
the-following-two-way-contingency-table-shows-the-relationship-between-which-area-a-student-liv-pa331
(Solved): The following two-way contingency table shows the relationship between which area a student liv ...
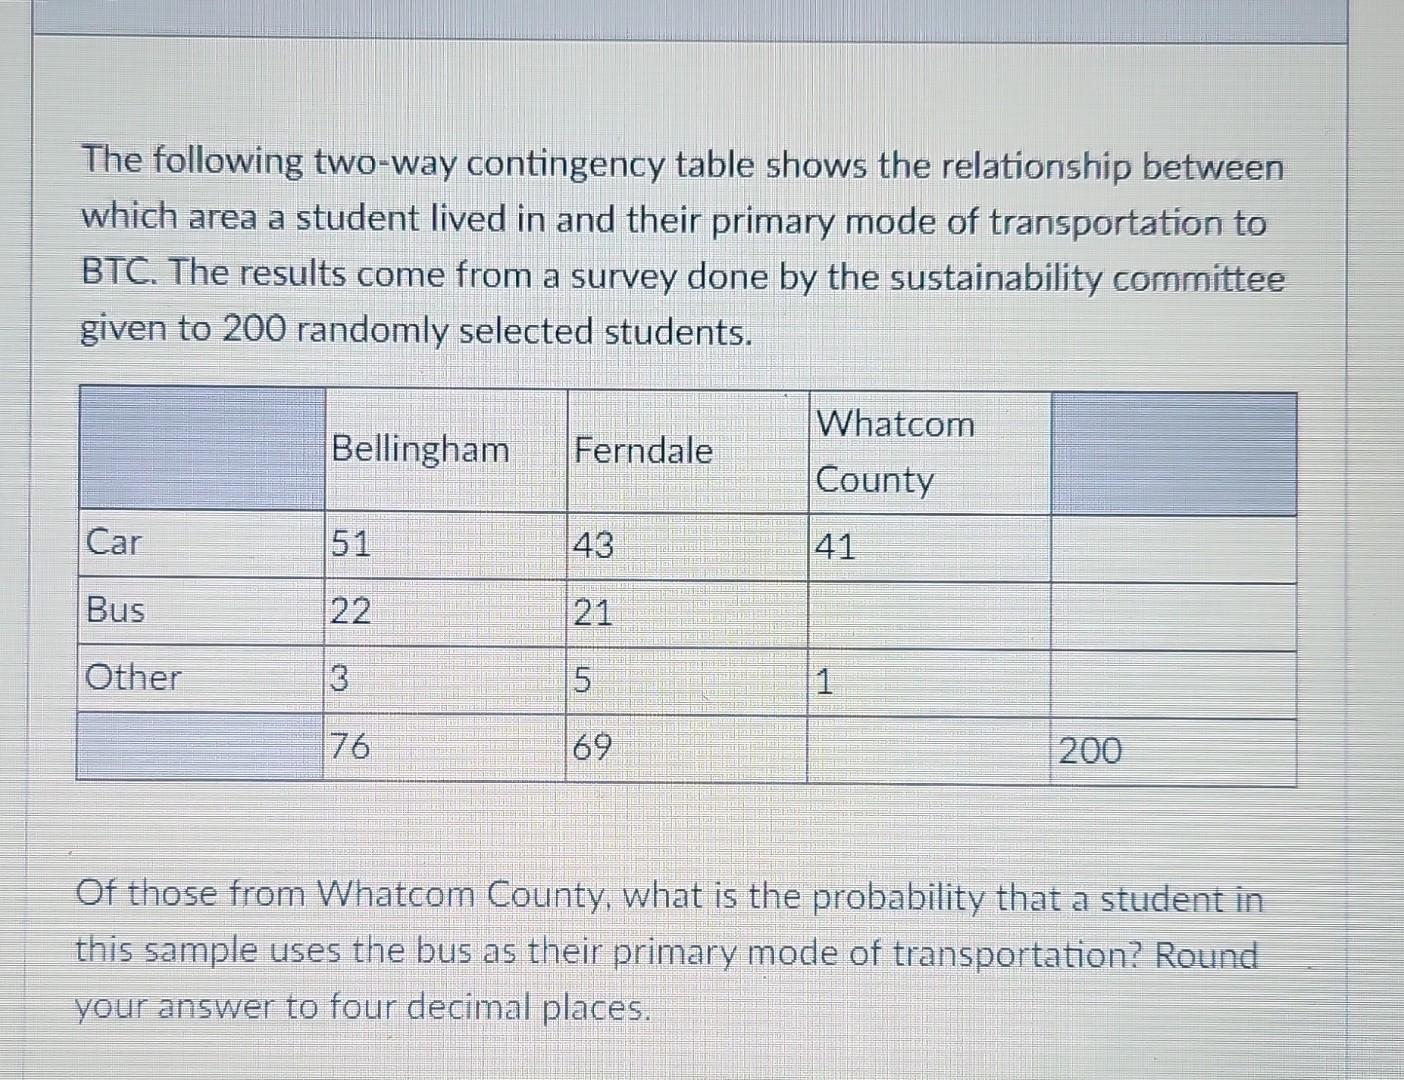
The following two-way contingency table shows the relationship between which area a student lived in and their primary mode of transportation to BTC. The results come from a survey done by the sustainability committee given to 200 randomly selected students. Of those from Whatcom County, what is the probability that a student in this sample uses the bus as their primary mode of transportation? Round your answer to four decimal places.